. 2025 Jun:83:103645.
doi: 10.1016/j.redox.2025.103645. Epub 2025 Apr 22.

Defective protein persulfidation is involved in obesity associated skeletal muscle dysfunction: role of SIRT-1

Affiliations

Defective protein persulfidation is involved in obesity associated skeletal muscle dysfunction: role of SIRT-1

M Smimmo et al. Redox Biol. 2025 Jun.

Abstract

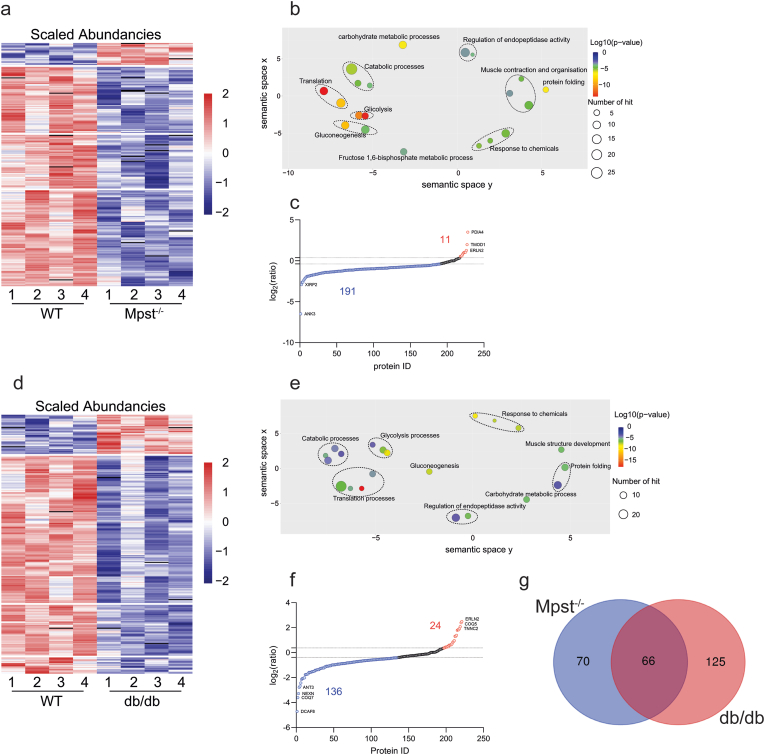
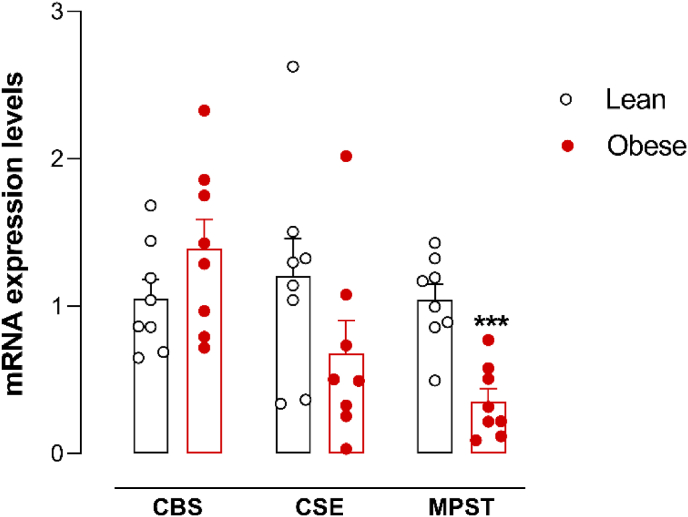
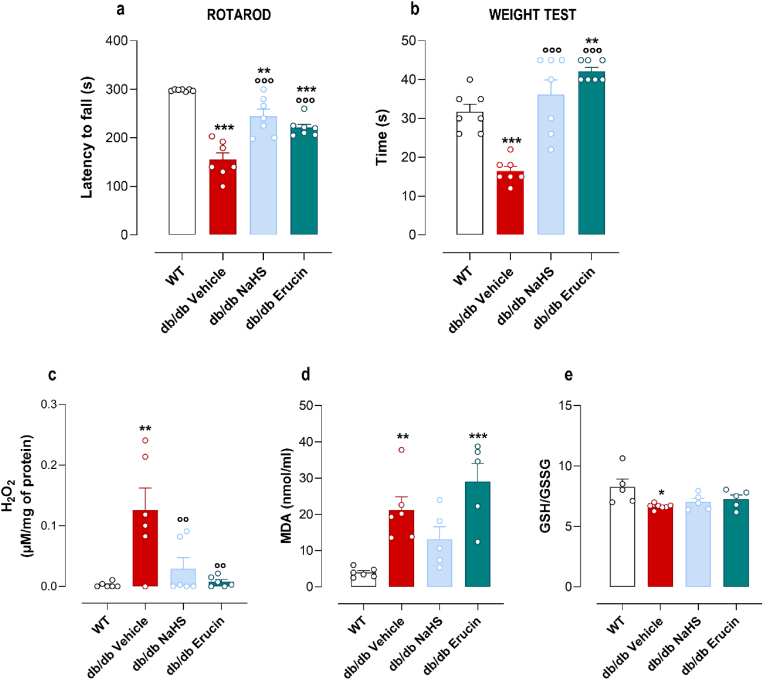
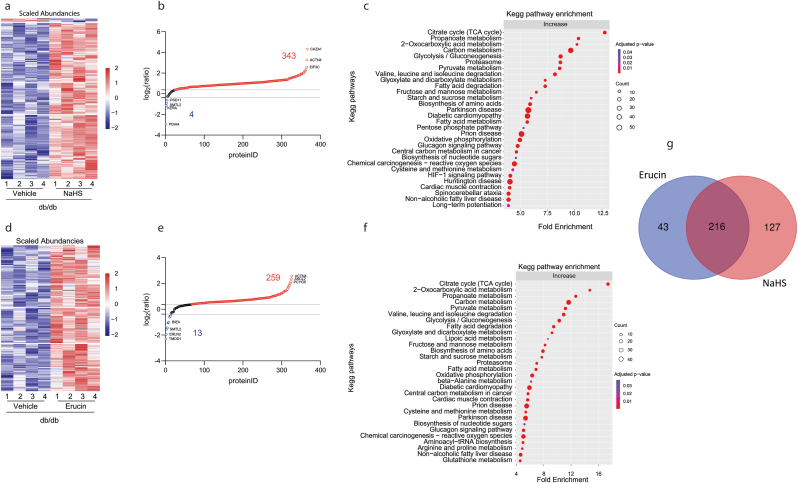
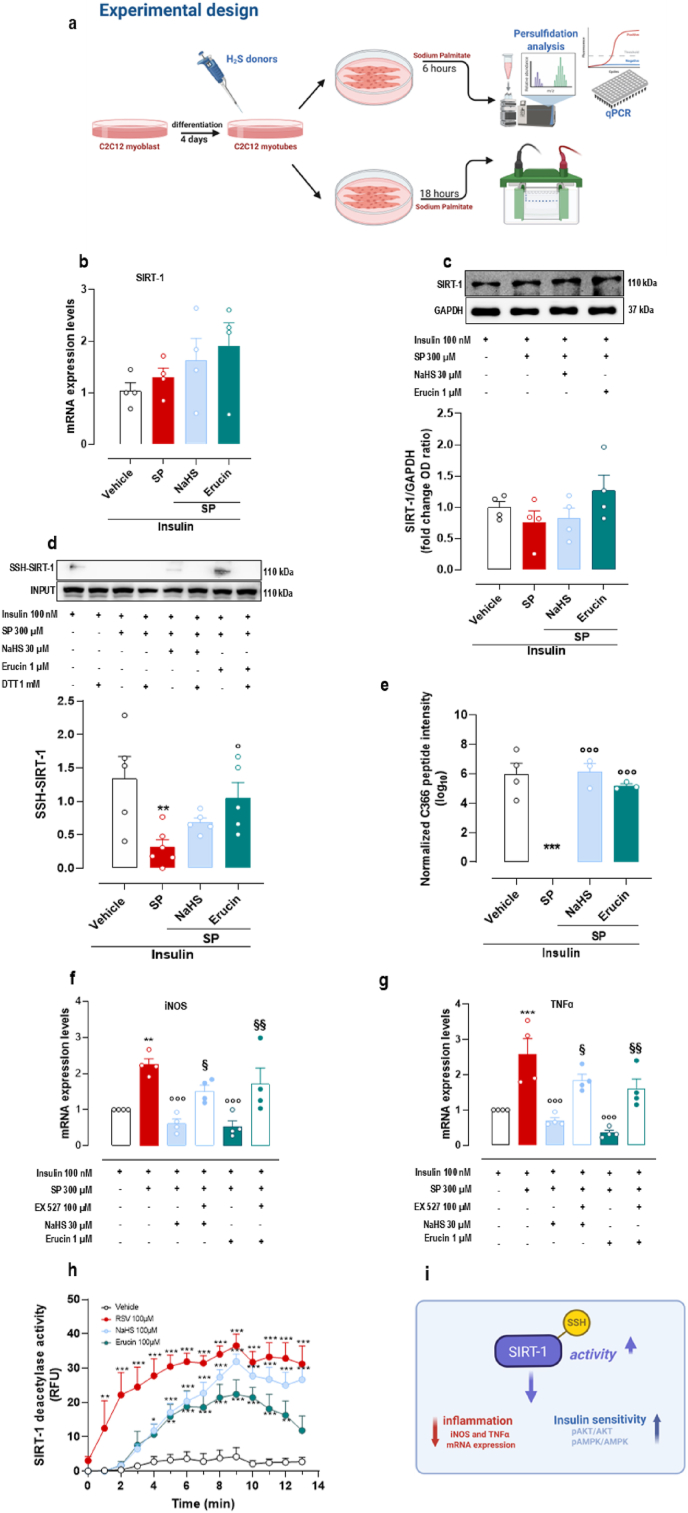
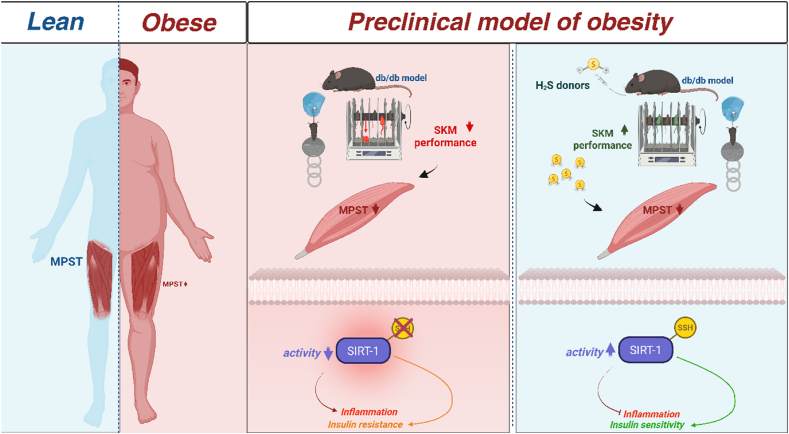
Ectopic fat deposition in skeletal muscle (SKM) due to obesity leads to biochemical and morphological alterations that deteriorate SKM quality and performance. Here, we show that impaired MPST-derived hydrogen sulfide (H2S) signaling contributes to obesity-related SKM dysfunction. Muscle tissues from obese db/db mice exhibit reduced MPST expression, correlating with decreased protein persulfidation and muscle performance in vivo. Mpst-/- mice show similar deficits as db/db mice, confirming the role of MPST. H2S supplementation improves locomotor activity in db/db mice and restores protein persulfidation, including SIRT-1. Myotubes placed in an "obese environment" display a downregulation of MPST, coupled with a reduced SIRT-1 persulfidation leading to an inflammatory state. Exogenous H2S exerts beneficial effects recovering SIRT-1 persulfidation/activity. Finally, muscle biopsies from obese individuals show reduced MPST expression, underscoring the translational relevance to human SKM health. Our study unveils a crucial role for MPST-derived H2S in obesity-associated SKM dysfunction via SIRT-1 persulfidation, highlighting the importance of the MPST/H2S pathway in maintaining healthy SKM function.

Keywords: Db/db mice; H(2)S donors; Persulfidation; Skeletal muscle; Sodium palmitate.


Conflict of interest statement

Declaration of competing interest The authors declare no conflict of interest.

Figures

Fig. 1
Fig. 1
In vivo evaluation of SKM performance and oxidative stress in QFA of WT, db/db and Mpst−/− mice. a,b Muscle coordination and strength evaluated by the rotarod (a) and weight (b) tests, were measured in WT (n = 8) and db/db (n = 8) mice at 10 weeks of age. c Quantification of transcripts levels of CBS, CSE, and MPST were evaluated by qPCR in QFA of WT (n = 5) and db/db mice (n = 5) at 10 weeks of age. Data are expressed as 2∧-ΔΔct relative to β-actin. d,e Muscle coordination and strength evaluated by the rotarod (d) and weight tests (e), were assessed in WT (n = 6), Cse−/− (n = 6), and Mpst−/− (n = 5–6) mice at 10 weeks of age. f,h Quantification of oxidative stress evaluated by measuring Malondialdehyde (MDA) levels (f), hydrogen peroxide (H2O2) levels (g), and glutathione (GSH)/glutathione oxidized (GSSG) ratio (h) was assessed in quadriceps harvested from WT (n = 5–6), db/db (n = 6–7) and Mpst−/− (n = 5–6) mice at 10 weeks of age. All data are expressed as mean ± SEM, and analyzed using an unpaired-t-test two-tailed for the results in a-c, and a one-way analysis of variance (ANOVA) followed by Dunnett's post hoc test for the results in d-h. Differences are considered statistically significant when p was ≤0.05. A single asterisk (∗), a double asterisk (∗∗), and a triple asterisk (∗∗∗) denote a p-value of ≤0.05, 0.01, and 0.001 vs WT mice, respectively.
Fig. 2
Fig. 2
Total protein persulfidation levels in QFA of WT, db/db, and Mpst−/− mice. a Heatmap showing the significant changes (>1.3-fold change) of PSSH in WT vs db/db mice (n = 4). b PSSH fold change levels normalized to the corresponding protein expression levels (related to A). c GO term enrichment (biological process) of the proteins showing significantly lower PSSH levels in db/db mice. Enrichment was performed using DAVID and the results visualized through REVIGO. Benjamini adjusted p-value <0.01. d Heatmap showing the significant changes (>1.3 fold change) of PSSH in WT vs Mpst−/− mice (n = 4). e PSSH fold change levels normalized to the corresponding protein expression levels (related to D). f GO term enrichment (biological process) of the proteins showing significantly lower PSSH levels in Mpst−/− mice. Enrichment was performed using DAVID and the results visualized through REVIGO. Benjamini adjusted p-value <0.01. g Venn diagram comparing protein targets found to have lower PSSH levels in db/db and Mpst−/− mice.
Fig. 3
Fig. 3
Metabolomic analysis in QFA of WT, db/db and Mpst−/− mice. a PC1 vs PC2 biplot derived from the PCA model performed on SKM pol ar metabolome data including three studied groups and eight metabolites involved in the H2S pathway. Keys: Wild type mice (WT, green, squares; n = 5), obese mice (db/db, pink, stars; n = 5), 3-mercaptopyruvate sulfurtransferase knock-out mice (Mpst−/−, red, diamonds; n = 5), metabolites (grey, dots). b In mammalian cells, the transsulfuration pathway (TSP) is a metabolic pathway that converts the amino acid l-methionine into l-cysteine. This pathway is crucial for the synthesis of sulfur compounds such as hydrogen sulfide (H2S), taurine, glutathione and 3-mercaptopyruvate (3-MP). The 3-MP is converted into H2S and pyruvate by the action of MPST. The reaction catalyzed by MPST comprises two successive sulfur transfer steps. In the first one, the sulfur atom is transferred from 3-MP to MPST, resulting in a cysteine persulfide intermediate (MPST-cys-S-SH) in the active site. In the second step-reaction, the sulfane sulfur is transferred to a thiophilic acceptor (depicted as R–SH), resulting in the regeneration of the MPST enzyme and a new persulfide product (RS-SH) from which H2S can be liberated. Similarly, the persulfidated MPST can react with reduced (thioredoxin) Trx realizing H2S and oxidized Trx. Abbreviation: CAT, cysteine aminotransferase; CBS, cystathionine beta-synthase; CDO cysteine dioxygenase; CSAD, cysteine sulfonic acid decarboxylase; CSE, cystathionine-γ-lyase; GS: glutathione synthase; HDD, hypotaurine dehydrogenase; MPST, 3-mercaptopyruvate sulfurtransferase; γ-GCS: Gamma-glutamylcysteine synthetase.
Fig. 4
Fig. 4
MRNA expression levels of H2S-generating enzymes genes in human QFA biopsies harvested from lean and obese subjects. Bar graphs showing the CBS, CSE and MPST mRNA expression levels in human QFA harvested from lean and obese human subjects (n = 8 for each group). Data are expressed as 2∧−ΔΔct relative to β-actin, and analyzed using an unpaired-t-test two-tailed. Differences are considered statistically significant when p was ≤0.05. A triple asterisk (∗∗∗) denotes a p-value of 0.001 vs lean.
Fig. 5
Fig. 5
Effect of H2S donors on locomotor activity in db/db mice. a,b Locomotory activity in terms of muscle coordination (a) and strength (b) was measured in WT (n = 7) and db/db mice treated with vehicle (PPB, n = 7), NaHS (3 mg/kg; n = 7) or Erucin (3 mg/kg; n = 7) for 4 weeks (from 6 to 10 weeks of age). c-e Oxidative stress evaluation in QFA of WT (n = 5–6) and db/db mice treated with vehicle (n = 6–7) or NaHS (n = 5–6) or Erucin (n = 5–6) for 4 weeks (from 6 to 10 weeks of age). Both H2S donors, reduced hydrogen peroxide (H2O2) production (c) while no changes were observed for Malondialdehyde (MDA) levels (d), and glutathione (GSH)/glutathione oxidized (GSSG) ratio (e). All data are expressed as mean ± SEM and analyzed using one-way analysis of variance (ANOVA) followed by Dunnett's post hoc test. Differences are considered statistically significant when p was ≤0.05. A single asterisk (∗), a double asterisk (∗∗), and a triple asterisk (∗∗∗) denote a p-value of ≤0.05, 0.01, and 0.001 vs WT mice, respectively. Double circle (.) and triple cycle (.°) denote a p-value of ≤0.01 and 0.001 vs db/db mice, respectively.
Fig. 6
Fig. 6
Effect of H2S donors on protein persulfidation levels in QFA of db/db mice. a Heatmap showing the significant changes (>1.3 fold change) of PSSH levels in muscle samples of NaHS-treated mice and WT mice (n = 4). b PSSH fold change levels normalized to the corresponding protein expression levels (related to a). c Kegg pathway enrichment analysis of proteins found to have significantly higher PSSH levels upon NaHS treatment. Benjamini adjusted p-value was used to filter for significant enrichment. d Heatmap showing the significant changes (>1.3 fold change) of PSSH levels in muscle samples of Erucin-treated mice and WT mice (n = 4). e PSSH fold change levels normalized to the corresponding protein expression levels (related to d). f Kegg pathway enrichment analysis of proteins found to have significantly higher PSSH levels upon Erucin treatment. Benjamini adjusted p-value was used to filter for significant enrichment. g Venn diagram comparing protein targets found to have higher PSSH levels in NaHS vs Erucin treatment.
Fig. 7
Fig. 7
Effect of H2S donors on insulin resistance and inflammation in vitro in C2C12 myotubes exposed to the hyperlipidaemic environment. a-d Western blot analysis showing the expression and/or phosphorylation of AKT a,b and AMPK c,d in vehicle and SP-exposed C2C12 cells treated or not with NaHS or Erucin and stimulated with insulin. C2C12 unstimulated were used as basal control (CTL). Fold change data represent the mean ± SEM of four separate experiments. The blots shown are representative of four independent experiments with similar outcomes. The GAPDH bands confirm that similar amounts of proteins were loaded on the gel for each sample. e Bar graphs showing the mRNA expression levels of GLUT-4 in vehicle (n = 7) and SP-exposed C2C12 cells treated or not (n = 7) with NaHS (n = 4) or Erucin (n = 4) and then stimulated with insulin. f,g Bar graphs showing the mRNA expression levels of iNOS (f) and TNFα (g) in control myotubes (n = 4) and SP-exposed myotubes treated or not (n = 4) with NaHS (n = 4) or Erucin (n = 4) and then stimulated with insulin. h Bar graphs showing the mRNA expression levels of CBS, CSE and MPST in control myotubes and SP-exposed myotubes (n = 5) then stimulated with insulin. Data are expressed as 2∧−ΔΔct relative to β-actin for the results in e-h. All data are expressed as mean ± SEM and analyzed using one-way analysis of variance (ANOVA) followed by Bonferroni's post hoc test for the results in a-g and an unpaired-t-test two-tailed for the results in g. Differences are considered statistically significant when p was ≤0.05. Single asterisk (∗), double asterisk (∗∗) and triple asterisk (∗∗∗) denote a p-value of ≤0.05, 0.01, 0.001 vs vehicle, respectively. Single circle (), double circle (○○) and triple circle (○○○) denote a p-value of ≤0.05, 0.01, 0.001 vs SP-exposed C2C12 group, respectively. Single ash (#) and triple ash (###) denote a p-value ≤0.05, 0.01, 0.001 vs. unstimulated C2C12 (CTL).
Fig. 8
Fig. 8
Effect of H2S donors on SIRT-1 expression and activity in vitro in C2C12 myotubes exposed to hyperlipidemic environment. a Schematic representation of experimental design performed in C2C12 myotubes. b Bar graphs showing the mRNA expression levels of SIRT-1 in control myotubes (n = 6) and SP-exposed myotubes treated or not (n = 4) with NaHS (n = 4) or Erucin (n = 4) and then stimulated with insulin. Data are expressed as 2∧−ΔΔct relative to β-actin. c Western blot analysis showing the changes in the expression of SIRT-1 in control myotubes (n = 4) and SP-exposed myotubes treated or not (n = 4) with NaHS (n = 4) or Erucin (n = 4) and then stimulated with insulin. Fold change data represent the mean ± SEM of four separate experiments. The blots shown are representative of four independent experiments with similar outcomes. The GAPDH bands confirm that similar amounts of proteins were loaded on the gel for each sample. d Persulfidation levels of SIRT-1 in control myotubes (n = 5) and SP-exposed myotubes treated or not (n = 6) with NaHS (n = 5) or Erucin (n = 5) and then stimulated with insulin. e Quantification of C354 PSSH levels of SIRT-1 in control myotubes (n = 4) and SP-exposed myotubes treated or not (n = 4) with NaHS (n = 3) or Erucin (n = 3) and then stimulated with insulin. f, g Bar graphs showing the mRNA expression levels of iNOS (f) and TNFα (g) in SP-exposed myotubes pre-treated with the selective SIRT-1 inhibitor, EX-527, following the addition of vehicle or NaHS or Erucin (n = 4). Data are expressed as 2∧−ΔΔct relative to β-actin. h Evaluation of SIRT-1 activity by cell-free assay. Data are expressed as relative fluorescence intensity (RFU). i Illustrative cartoon of the signaling pathways involved in SIRT-1 persulfidation. All data are expressed as mean ± SEM and analyzed using one-way analysis of variance (ANOVA) followed by Dunnett's and Bonferroni's post hoc test for the results in b-e and f, g respectively, and two-way analysis of variance (ANOVA) followed by Dunnett's post hoc test for the results in h. Differences are considered statistically significant when p was ≤0.05. Single asterisk (∗), double asterisk (∗∗) and triple asterisk (∗∗∗) denote a p-value of ≤0.05, 0.01, 0.001 vs vehicle, respectively. Single circle () and triple circle (○○○) denote a p-value of ≤0.05, 0.001 vs SP-exposed C2C12 group, respectively. Single dollar (§) and double dollar (§§) denote a p-value ≤0.05, 0.01, vs. NaHS or Erucin respectively.
Fig. 9
Fig. 9
Graphical abstract was created with BioRender.com.

References

    1. Vellecco V., Mancini A., Ianaro A., Calderone V., Attanasio C., Cantalupo A., Andria B., Savoia G., Panza E., Di Martino A., Cirino G., Bucci M. Cystathionine β-synthase-derived hydrogen sulfide is involved in human malignant hyperthermia. Clin. Sci. (Lond.) 2016;130:35–44. doi: 10.1042/CS20150521. - DOI - PubMed
    1. Panza E., Vellecco V., Iannotti F.A., Paris D., Manzo O.L., Smimmo M., Mitilini N., Boscaino A., de Dominicis G., Bucci M., Di Lorenzo A., Cirino G. Duchenne's muscular dystrophy involves a defective transsulfuration pathway activity. Redox Biol. 2021;45 doi: 10.1016/j.redox.2021.102040. - DOI - PMC - PubMed
    1. Sbodio J.I., Snyder S.H., Paul B.D. Regulators of the transsulfuration pathway. Br. J. Pharmacol. 2019;176:583–593. doi: 10.1111/bph.14446. - DOI - PMC - PubMed
    1. Vellecco V., Armogida C., Bucci M. Hydrogen sulfide pathway and skeletal muscle: an introductory review. Br. J. Pharmacol. 2018;175:3090–3099. doi: 10.1111/bph.14358. - DOI - PMC - PubMed
    1. Cirino G., Vellecco V., Bucci M. Nitric oxide and hydrogen sulfide: the gasotransmitter paradigm of the vascular system. Br. J. Pharmacol. 2017;174:4021–4031. doi: 10.1111/bph.13815. - DOI - PMC - PubMed

LinkOut - more resources