. 2025 Jun:83:103654.
doi: 10.1016/j.redox.2025.103654. Epub 2025 Apr 29.

TJ0113-induced mitophagy in acute liver failure detected by Raman microspectroscopy

Affiliations

TJ0113-induced mitophagy in acute liver failure detected by Raman microspectroscopy

Chunlian Huang et al. Redox Biol. 2025 Jun.

Abstract

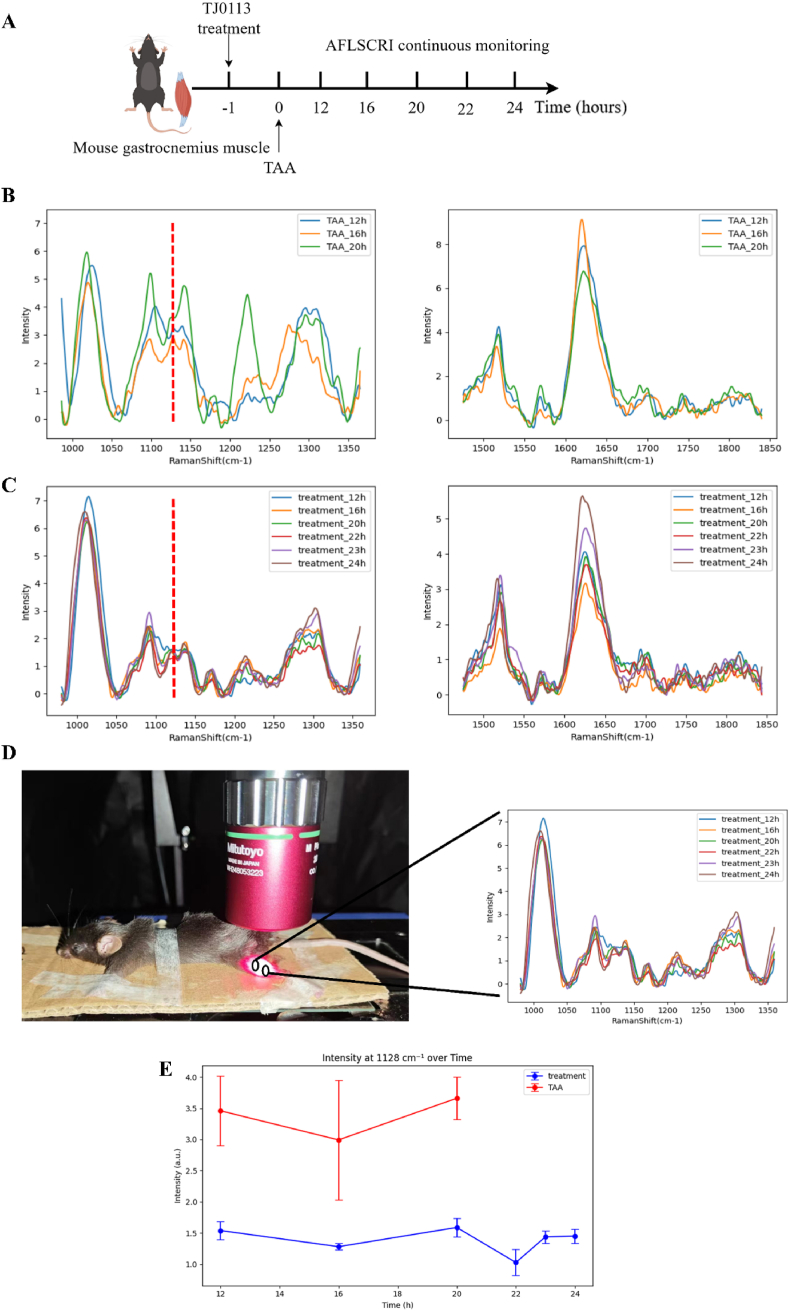
Impaired mitophagy underlies the pathophysiology of acute liver failure (ALF) and is closely associated with tissue damage and dysfunction. A novel mitophagy inducer, TJ0113, was used for treatment during ALF pathogenesis. In this study, we used a novel mitophagy inducer, TJ0113, to investigate the effects and mechanisms of TAA-induced ALF mice. The results showed that TJ0113 could enhance mitophagy through Parkin/PINK1 and ATG5 pathways, which in turn attenuated mitochondrial damage, hepatocyte apoptosis, nuclear factor (NF)-κB/NLRP3 signaling activation and inflammatory responses after TAA. Metabolomics results showed that TJ0113 mainly regulated lipid metabolism, amino acid metabolism and nucleotide metabolism in the livers of ALF mice. RNA sequencing (RNA-seq) analysis yielded that TJ0113 was involved in the development of ALF by regulating the P13K/AKT signaling pathway. The key highlight of this work is the use of an aberration-free line-scanning confocal Raman imager (AFLSCRI) to study the molecular changes in blood, liver tissue, gastrocnemius muscle, and mitochondrial extracts in ALF mice after TJ0113 treatment. Compared to the measurement with conventional assays, Raman microspectroscopy (micro-Raman) offers the benefits of being rapid, non-invasive, label-free and real-time. Our results found good agreement between Raman signals and histopathologic findings. The system has good performance with a spatial resolution of 2 μm, a spectral resolution of 4 cm-1 and a fast detection speed improved by 2 orders. Innovations in this test contribute to clinical diagnosis of disease, personalized treatment, effective intraoperative guidance and accurate prognosis. The data may help in the development of a non-invasive clinical device for mitochondrial damage using bedside micro-Raman.

Keywords: Aberration-free line-scanning confocal Raman imaging; Acute liver failure; Mitophagy; Point-scan Raman imaging; Raman signal; TJ0113.


Conflict of interest statement

Declaration of competing interest This manuscript has not been published or presented elsewhere in part or in entirety and is not under consideration by another journal. Animal experiments were approved by the Animal Experimentation Ethics Committee of Taizhou Hospital, Zhejiang Province (Approval No. tzy-2023216). We have read and understood your journal's policies, and we believe that neither the manuscript nor the study violates any of these. There are no conflicts of interest to declare.

Figures

Image 1
Graphical abstract
Fig. 1
Fig. 1
Raman signal variations in the blood of different mouse groups over time. (A–E) Show the results of Raman detection of the tail vein blood of mice at 8 h, 18 h, 24 h, 27 h, and 30 h, respectively. Each set of images includes four graphs covering the ranges from 400 cm−1 to 1800 cm−1, 700 cm−1 to 800 cm−1, 1110 cm−1 to 1180 cm−1, and 1550 cm−1 to 1620 cm−1. (F) Depicts the normalized intensity of the peak at 1128 cm−1, with 1008 cm−1 as the reference, showing the time-dependent changes in this characteristic peak for the five groups of mice. (G) micro-Raman continuous monitoring timeline.
Fig. 2
Fig. 2
Raman signals from liver tissue and mitochondrial extracts as well as images of liver tissue TEM. (A) Raman signals of liver tissue samples from five different mouse groups. (B) Raman signal (1000-1400 cm−1) of mitochondrial extracts from five different mouse groups. (C)Raman signal (1450-1870 cm−1) of mitochondrial extracts from five different mouse groups. (D) Representative TEM images of TAA-induced mitochondrial morphology in hepatocytes of ALF mice. 3000× magnification (top) and 8000× (bottom) magnification; Scale bar: 5 μm and 2 μm. Nucleus (N); Nucleolus (Nu); Mitochondria (M); Rough endoplasmic reticulum (RER); Lipid droplets (LD); Autophagic vesicles (AP); Autophagic lysosomes (ASS); Microsomes (MB); Collagen fibers (CF); Golgi apparatus (GO).
Fig. 3
Fig. 3
Temporal variations in Raman signals at gastrocnemius muscles of two groups of mice. (A) Timeline. (B) Raman signals of the gastrocnemius muscle in TAA group mice. (C) Raman signals of the gastrocnemius muscle in TJ0113-treated group mice. (D) One mouse anesthetized and fixed under our line scanning confocal Raman imager for Raman imaging. (E) The time variation of the normalized Raman signal of the gastrocnemius muscle at 1128 cm−1 for two groups of mice.
Fig. 4
Fig. 4
Assessment of the therapeutic effects of TJ0113 on mice based on Raman detection at gastrocnemius muscle. (A) Schematic diagram of in vivo experiment design.(B) Raman monitoring flow chart. (C) Raman detection results of the gastrocnemius muscle in mice administered TJ0113 1 h before TAA induction (treatment1). (D) Raman detection results of the gastrocnemius muscle in mice administered TJ0113 4 h after TAA induction (treatment2). (E) Raman detection results of the gastrocnemius muscle in mice administered TJ0113 12 h after TAA induction (treatment3). (F) Raman detection results of the gastrocnemius muscle in TAA group mice. (G) Raman detection results of the gastrocnemius muscle in normal control group mice. (H) The time variation of the normalized Raman signal of the gastrocnemius muscle at 1128 cm−1 for four groups of mice.
Fig. 5
Fig. 5
TJ0113 enhanced mitophagy and ameliorated mitochondrial damage in ALF mouse hepatocytes. (A) Representative images of different groups of ALF mice immune-fluorescently double-labeled with TOM20 (green) and LAMP1 (red), magnified (1000×). (B) Representative immunoblotting images and quantification of mitochondrial dynamics-related proteins Mfn2 (C), OPA1 (D) and Drp1 (E) in liver tissue. (G) Representative IHC images (200X and 400X) and (F) quantification of 8-OHDG positive cells in liver sections. Compared with the control group, ∗∗p < 0.01, ∗∗∗∗p < 0.001. Compared with the TAA group, #p < 0.05, ##p < 0.01, ###p < 0.001; ns, not significant. Data are expressed as mean ± SD.
Fig. 6
Fig. 6
TJ0113 acts on Mcl-1 targets through the PINK1/Parkin and ATG5 pathway and subsequently binds to LC3A to induce mitophagy. (A) Representative images of different groups of ALF mice immune-fluorescently double-labeled with Mcl-1 (green) and LC3A (red). The mRNA expression levels of Mcl-1 (B) and LC3A (C) in liver tissues. (D) Representative immunoblotting images and quantification of mitophagy pathway proteins including PINK1(H) and Parkin(I) in liver tissues. (K) Representative immunostaining (200X and 400X) and (J) quantification of ATG5 in liver tissues. Compared with the control group, ∗p < 0.05, ∗∗p < 0.01, ∗∗∗∗p < 0.001. Compared with the TAA group, #p < 0.05, ##p < 0.01, ###p < 0.001; ns, not significant. Data are expressed as mean ± SD.
Fig. 7
Fig. 7
Effects of TJ0113 on hepatic gene and metabolite expression 24 h after TAA injection and TJ0113 can regulate ALF progression through the P13K/AKT pathway. (A) Volcano plot of differentially expressed metabolites between TAA and TAA + TJ0113 groups (n = 3/group). (B) Categorical plot of differentially expressed metabolites between TAA and TAA + TJ0113 groups. (C) KEGG analysis of differentially metabolites between TAA group and TAA + TJ0113 group. (D) Volcano plot of differentially expressed genes between TAA and TAA + TJ0113 groups. (E) Venn of the intersection between Control vs TAA and TAA vs TAA + TJ0113 groups. (F) Top20 histogram of KEGG pathway differentially expressed gene enrichment in TAA group vs. TAA + TJ0113 group. (G) Further KEGG enrichment analysis revealed a dominant biological pathway induced by TJ0113 in the livers of TJ0113-treated mice compared to TAA. (H) GSEA analysis of P13K/AKT signaling pathway in TAA and TAA + TJ0113 groups. (I) RNA-seq-based heatmap of the average expression levels of identified genes in the P13K/AKT signaling pathway in TAA group and TAA + TJ0113 group. (J) Representative immunoblotting images and quantification of p-AKT/AKT (K) and p-P13K/P13K (L). Compared with the control group, ∗∗p < 0.01. Compared with the TAA group, ##p < 0.01. Data are expressed as mean ± SD.
Fig. 8
Fig. 8
TJ0113 ameliorates liver function and liver injury and improves survival in ALF mice. (A–B) Representative images (100X and 400X) of the naked eye view as well as hematoxylin and eosin (H&E) staining of the liver of each group of mice. (C) Hepatic necrosis H&E staining score. At 100× magnification, six ranges were randomly selected and the total score for each section was calculated. Serum levels of AST (D) and ALT (E) in mice in each group. (F) TJ0113 Survival of mice at 36 h in each group at different doses and modes of administration. ELISA for the expression levels of IL-1β (G), IL-6 (H) and TNF-α (I) in mouse serum. Compared with the control group, ∗∗∗∗p < 0.0001. Compared with the TAA group, ##p < 0.01, ###p < 0.001, ####p < 0.0001; ns, not significant. Data are expressed as mean ± SD.
Fig. 9
Fig. 9
TJ0113 ameliorates massive apoptosis and activation of the NF-kB/NLRP3 pathway in hepatocytes from ALF mice. (A-B)TUNEL staining was used to detect the number of apoptotic cells in liver tissue sections and the percentage apoptosis score of hepatocytes. (C) Representative immunoblotting images and quantification of Bax (D), pro-Caspase-3 (E), Caspase-3 (F) and Bcl-2 (G). (H) Representative immunoblotting images and quantification of NF-kB (I), NLRP3 (J), ASC (K) and IL-1β (L) in liver tissue. (M) Immunofluorescence images of NLRP3. Compared with the control group, ∗p < 0.05, ∗∗p < 0.01, ∗∗∗∗p < 0.0001. Compared with the TAA group, #p < 0.05, ##p < 0.01, ####p < 0.0001; ns, not significant. Data are expressed as mean ± SD.

Similar articles

References

    1. Luo T., Yang S., Zhao T., Zhu H., Chen C., Shi X., Chen D., Wang K., Jiang K., Xu D., et al. Hepatocyte DDX3X protects against drug-induced acute liver injury via controlling stress granule formation and oxidative stress. Cell Death Dis. 2023;14(7):400. - PMC - PubMed
    1. Bernal W., Wendon J. Acute liver failure. N. Engl. J. Med. 2013;369(26):2525–2534. - PubMed
    1. Bernal W., McPhail M.J. Acute liver failure. J. Hepatol. 2021;74(6):1489–1490. - PubMed
    1. Jiao F., Zhang Z., Hu H., Zhang Y., Xiong Y. SIRT6 activator UBCS039 inhibits thioacetamide-induced hepatic injury in vitro and in vivo. Front. Pharmacol. 2022;13 - PMC - PubMed
    1. Jiao F.Z., Wang Y., Zhang W.B., Zhang H.Y., Chen Q., Shi C.X., Wang L.W., Gong Z.J. Protective role of AGK2 on thioacetamide-induced acute liver failure in mice. Life Sci. 2019;230:68–75. - PubMed

Substances

LinkOut - more resources