. 2025 May 3;11(1):106.
doi: 10.1038/s41531-025-00948-7.

Emergent glutamate & dopamine dysfunction in VPS35(D620N) knock-in mice and rapid reversal by LRRK2 inhibition

Affiliations

Emergent glutamate & dopamine dysfunction in VPS35(D620N) knock-in mice and rapid reversal by LRRK2 inhibition

A Kamesh et al. NPJ Parkinsons Dis. .

Abstract

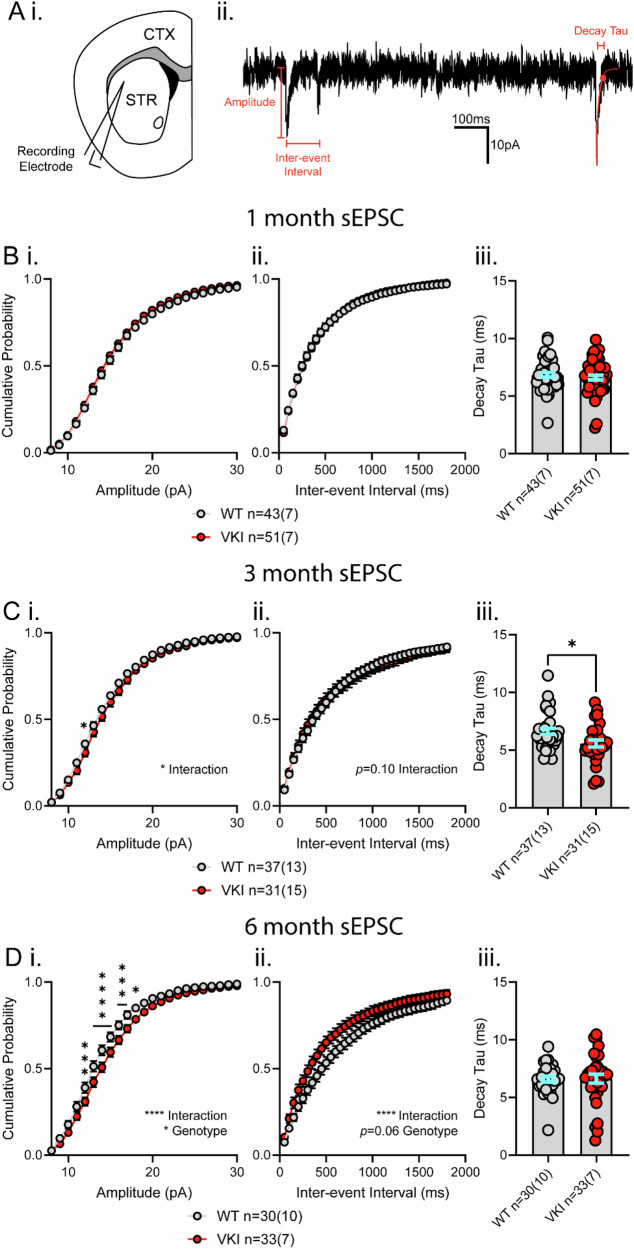
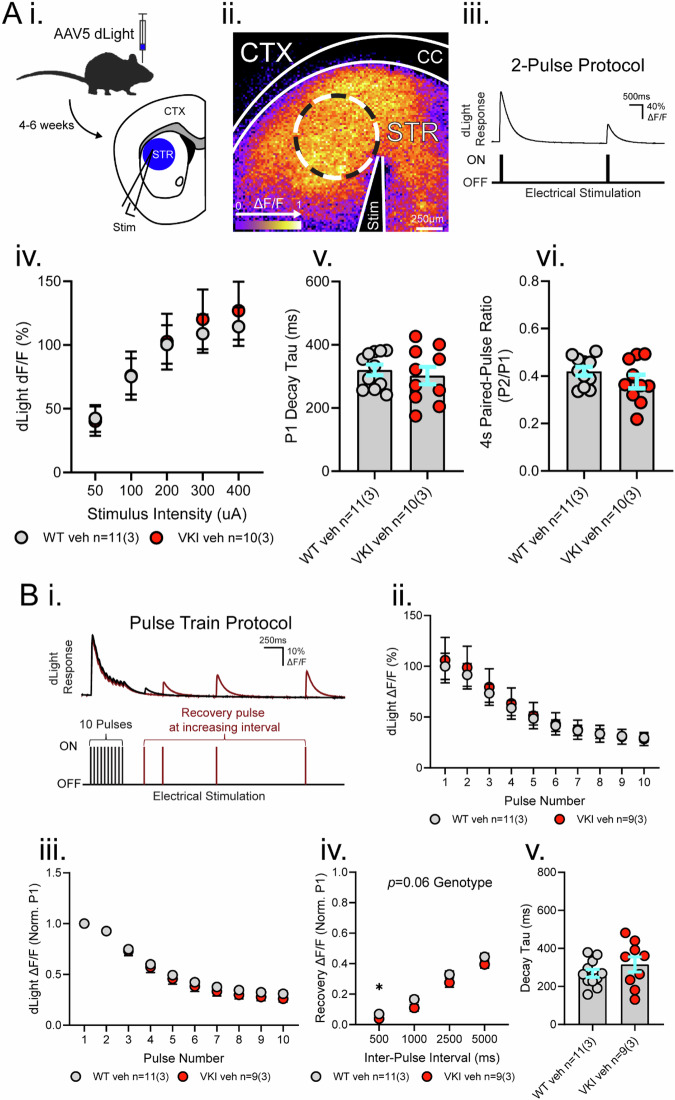
The D620N variant in Vacuolar Protein Sorting 35 (VPS35) causes autosomal-dominant, late-onset Parkinson's disease. VPS35 is a core subunit of the retromer complex that canonically recycles transmembrane cargo from sorting endosomes. Although retromer cargoes include many synaptic proteins, VPS35's neuronal functions are poorly understood. To investigate the consequences of the Parkinson's mutation, striatal neurotransmission was assessed in 1- to 6-month-old VPS35 D620N knock-in (VKI) mice. Spontaneous and optogenetically-evoked corticostriatal glutamate transmission was increased in VKI spiny projection neurons by 6 months and was unaffected by acute leucine-rich repeat kinase 2 (LRRK2) inhibition. Total striatal glutamate release by iGluSnFR imaging was similar to wild-type. dLight imaging revealed robust increases in VKI striatal dopamine release by 6 months, which were reversed with acute LRRK2 kinase inhibition. We conclude that increased striatal neurotransmission in VKI mice progressively emerges in young-adulthood, and that dopamine dysfunction is likely the result of sustained, rapidly-reversible, LRRK2 hyperactivity.


Conflict of interest statement

Competing interests: The authors declare no competing interests.

Figures

Fig. 1
Fig. 1. Spontaneous glutamate transmission increases in dorsolateral striatal VKI SPNs emerges by 6 months.
A i) Schematic depicting whole-cell patch-clamp recording of spiny projection neurons (SPNs) in the dorsolateral striatum (STR) from acute coronal brain sections also containing cortex (CTX). ii) Representative trace of voltage-clamp recording of spontaneous excitatory post-synaptic current (sEPSC) from dorsolateral striatal SPNs. Representations of amplitude, inter-event interval, and decay tau measurements annotated in red. B At 1 month, i) cumulative probability distributions of sEPSC amplitude are not significantly different between VKI and WT SPNs (2-way ANOVA Interaction p > 0.99, genotype p = 0.22). ii) Cumulative probability distributions of inter-event intervals are not significantly different between VKI and WT SPNs (2-way ANOVA interaction p = 0.99, genotype p = 0.93). iii) sEPSC decay tau is not significantly different between VKI and WT SPNs (Unpaired t-test p = 0.43). C At 3 months, i) cumulative probability distributions show VKI SPNs have more, larger amplitude sEPSC than WT SPNs (2-way ANOVA interaction p = 0.02, genotype p = 0.21). ii) sEPSC inter-event intervals are not significantly different between genotypes (2-way ANOVA interaction p = 0.10, genotype p = 0.95). iii) Average sEPSC decay tau is significantly faster in VKI vs WT neurons (Mann-Whitney U-test p = 0.01). D At 6 months, i) cumulative distributions show a significantly higher number of larger-amplitude sEPSCs in VKI neurons (2-way ANOVA interaction p < 0.0001, genotype p = 0.02). ii) Cumulative distributions of sEPSC inter-event intervals indicate VKI neurons have shorter inter-event intervals than WT neurons (2-way ANOVA interaction p < 0.0001, genotype p = 0.06). iii) Average sEPSC decay taus are not significantly different in VKI vs WT neurons (Mann-Whitney U-test p = 0.65). Asterisks denote pairwise comparisons; * 0.05>p > 0.01, ** 0.01>p > 0.001, *** 0.001>p > 0.0001, **** p > 0.0001. 2-way ANOVA comparisons listed if p < 0.10.
Fig. 2
Fig. 2. Evoked corticostriatal glutamate transmission increases in VKI SPNs by 6 months.
A i) Schematic depicting ChR2 viral injection into motor cortex 4–6 weeks prior to preparation of acute coronal slices containing CTX and STR. Whole-cell patch-clamp recordings were obtained from dorsolateral striatal SPNs +/- NMDAR inhibitor, APV. ii) Representative ChR2-PSC traces in response to single pulses of light. SPNs that were held at membrane potentials of -70 mV or +40 mV (in black), and +40 mV in the presence of AP5 (in cyan). B At 3 months, i) the peak amplitude of AMPAR-mediated currents at -70 mV are not significantly different between WT and VKI SPNs (Unpaired t-test p = 0.46). ii) Amplitude of NMDAR-mediated currents are not significantly different between genotypes at +40 mV (Unpaired t-test p = 0.87). iii) Ratios of +40 mV NMDAR current to -70 mV AMPAR current are not significantly different between WT and VKI SPNs (Unpaired t-test p = 0.60). iv) Rectification Index of AMPA current is not significantly different between WT and VKI SPNs (Unpaired t-test p = 0.45). C At 6 months, i) VKI SPNs show larger currents than WT SPNs, in peak amplitude of both AMPAR-mediated current (Mann-Whitney U-test p = 0.01) and ii) NMDAR-mediated current (Unpaired t-test p = 0.0005). iii) Ratio of NMDA:AMPA currents are not significantly different between genotypes (Unpaired t-test p = 0.90). iv) AMPA Rectification Index is not significantly different between WT and VKI SPNs (Unpaired t-test p = 0.67). D i) Representative ChR2-PSCs with 4 pulses of ChR2 stimulation (in red), 100 ms inter-pulse interval. ii) At 3 months, the paired pulse ratio (PPR) of 4 responses to ChR2 stimulation, normalized to the first response, is not significantly different between VKI and WT SPNs (2-way ANOVA interaction p = 0.34, genotype p = 0.22). iii) At 6 months, the paired pulse ratio is significantly reduced in VKI vs WT SPNs (2-way ANOVA interaction p = 0.001, genotype p = 0.04).
Fig. 3
Fig. 3. Spontaneous and evoked striatal glutamate transmission are not sensitive to acute LRRK2 kinase inhibition.
A sEPSC cumulative probability distributions were analyzed together and displayed by genotype. Statistics were performed using 2-way ANOVA on WT veh vs VKI veh vs WT MLi-2 vs VKI MLi-2 with relevant post-hoc comparisons. i) WT sEPSC amplitude is not differentially distributed with acute MLi-2 treatment when compared to vehicle (veh) control (2-way ANOVA interaction p = 0.72, genotype p = 0.86, Šídák’s multiple comparisons test p=ns). ii) MLi-2 treatment does not alter cumulative probability distributions of inter-event intervals in WT SPNs (2-way ANOVA interaction p = 0 > 0.99, genotype p = 0.65, Šídák’s multiple comparisons test p=ns). B i) VKI sEPSC amplitudes are not altered in cumulative probability distributions with MLi-2 treatment when compared to vehicle control (Šídák’s multiple comparisons test p=ns). ii) MLi-2 treatment does not alter cumulative probability distributions of inter-event intervals in VKI SPNs Šídák’s multiple comparisons test p = ns). C sEPSC decay is not altered by MLi-2 treatment in either WT or VKI SPNs (Kruskal-Wallis test p = 0.62). D PPRs of ChR2 responses were analyzed together and displayed by genotype. Statistics were performed using 2-way ANOVA on WT veh vs VKI veh vs WT MLi-2 vs VKI MLi-2 with relevant post-hoc comparisons. i) PPRs of WT SPN responses to ChR2 stimulation were not altered by MLi-2 treatment when compared to vehicle treatment (2-way ANOVA interaction p = 0.41, genotype p = 0.80, Šídák’s multiple comparisons test p=ns). ii) PPRs of VKI SPN responses to ChR2 stimulation were not altered by MLi-2 treatment when compared to vehicle treatment (Šídák’s multiple comparisons test p=ns).
Fig. 4
Fig. 4. Total striatal glutamate release in VKIs normalizes to WT levels by 6 months.
A i) Graphic depicting viral injection of iGluSnFR in dorsolateral striatum 4–6 weeks prior to acute slice preparation. ii) Area of iGluSnFR expression in coronal slices containing CTX and STR depicted in green along with stimulus electrode (Stim) placed in dorsolateral STR. iii) Visualization of intensity-based glutamate-sensing fluorescent reporter (iGluSnFR) change in fluorescence relative to baseline (ΔF/F) in dorsolateral STR in response to local electrical stimulation (Stim). Low to high ΔF/F as a ratio of 0 to 1 represented as a gradient from purple to white, respectively. Boundaries of the corpus callosum (CC) separate CTX and STR in a coronal brain slice. Dashed circle represents region of interest (ROI) of 20 pixels used for iGluSnFR analysis. ii) Representative iGluSnFR response corresponding to trains of 10x10Hz pulses of electrical stimulation followed by 11th pulse at increasing interval with each of 4 repetitions. Black trace represents 1st of 4 stimulations with subsequent stimulations overlayed in maroon. B At 3 months, i) VKI vs WT iGluSnFR response size (ΔF/F) is significantly smaller in VKI brain slices (2-way ANOVA interaction p < 0.0001, genotype p = 0.007). ii) When normalized to 1st pulse (Norm. P1), VKI iGluSnFR responses are significantly different from WT (2-way ANOVA interaction p = 0.006, genotype p > 0.99). iii) VKI and WT recovery after 10x10Hz stimulation, normalized to 1st pulse, are similar (2-way ANOVA interaction p = 0.84, genotype p = 0.50). iv) Decay of the last response in pulse train (P10) is similar between VKI and WT iGluSnFR responses (Unpaired t-test p = 0.17). C At 6 months, i) VKI vs WT iGluSnFR response size is similar in VKI and WT brain slices (2-way ANOVA interaction p = 0.90, genotype p = 0.40). ii) Normalized VKI iGluSnFR responses are not significantly different from WT (2-way ANOVA interaction p = 0.77, genotype p = 0.87). iii) VKI recovery capacity after 10 x 10 Hz stimulation is similar to WT capacity (2-way ANOVA interaction p = 0.63, genotype p = 0.12). iv) Decay of the last response to 10x10Hz stimulation is not different between VKI and WT iGluSnFR responses (Mann-Whitney U-test p = 0.33).
Fig. 5
Fig. 5. dLight responses to electrical stimulation are not altered in VKI brain slices at 3 months.
A i) Graphic depicting stereotaxic injection of AAVs encoding for dLight in dorsolateral STR 4-6 weeks prior to acute slice preparation. Area of dLight expression in coronal slices containing CTX and STR depicted in blue with Stim placed in dorsolateral STR. ii) Visualization of dLight change in fluorescence from baseline (ΔF/F) in response to local electrical stimulation (ΔF/F values of 0 to 1 represented as a gradient from purple to white, respectively). Boundaries of the CC separate CTX and STR in a coronal brain slice. Dashed circle represents ROI of 40 pixels used for dLight analysis. iii) Representative dLight response in dorsolateral striatum corresponding to 2 pulses delivered with 4 s inter-pulse interval. At 3 months iv) Increasing stimulus intensity did not alter size of dLight responses in VKI vs WT STR (2-way ANOVA interaction p = 0.69, genotype p = 0.83). v) Decay of the 1st response peak (P1) is similar between VKI and WT brain slices (Unpaired t-test p = 0.57). vi) PPR at 4 s (P2 Peak/P1 Peak) is similar between VKI and WT brain slices (Unpaired t-test p = 0.21). B i) Representative dLight response in dorsolateral STR corresponding to 4x stimulation with 10 x 10 Hz pulse train and subsequent recovery stimulation. At 3 months ii) dLight responses were not significantly different in size between VKI and WT brain slices (2-way ANOVA interaction p = 0.99, genotype p = 0.85). iii) dLight responses relative to 1st pulse (P1) were not different between VKIs and WTs (2-way ANOVA interaction p = 0.69, genotype p = 0.45). iv) Recovery capacity following 10x10Hz stimulation are lower in VKI brain slices (2-way ANOVA interaction p = 0.81, genotype p = 0.06). v) Decay of the pulse train response is not significantly different in VKI vs WT brain slices (Unpaired t-test p = 0.28).
Fig. 6
Fig. 6. Dopamine release in VKI brain slices at 6 months is elevated and can be reduced with acute MLi-2 treatment.
A i) Graphic depicting stereotaxic injection of AAVs encoding for dLight into the dorsolateral striatum 4-6 weeks prior to acute slice preparation. Coronal slices containing CTX and STR were subsequently incubated ≥1.5 h with either vehicle Captisol® or 500 nM MLi-2 prior to recording. dLight expression is depicted in blue with Stim in dorsolateral STR. ii) Representative 2-pulse stimulation with 4 s inter-pulse interval with accompanying dLight response. B dLight responses were analyzed together (WT veh vs VKI veh vs WT MLi-2 vs VKI MLi-2) and graphed separately. i) VKI responses are increased across increasing stimulus intensities compared to WT responses (2-way ANOVA interaction p = 0.0003, genotype p = 0.0001, Šídák’s multiple comparisons test @50 µA p=ns, 100–400 µA p > 0.05). ii) MLi-2 treatment does not alter WT dLight responses (Šídák’s multiple comparisons test p=ns). iii) MLi-2 treatment reduces elevated dLight responses in VKI brain slices (Šídák’s multiple comparisons test @50 µA p = 0.07, @100-400 µA p < 0.05). iv) Decay of 1st response is not different between VKI and WT brain slices and is not sensitive to MLi-2 treatment (Kruskal-Wallis p = 0.66). v) PPR at 4 s interval is not different between VKI and WT brain slices and is not sensitive to MLi-2 treatment (Kruskal-Wallis p = 0.69).
Fig. 7
Fig. 7. Striatal dopamine release with train stimulation is larger in VKI brain slices and sensitive to acute MLi-2 treatment.
A i) Graphic depicting stereotaxic injection of AAVs encoding for dLight into the dorsolateral STR 4-6 weeks prior to acute slice preparation. Coronal slices containing CTX and STR were subsequently incubated >1.5 h with either vehicle Captisol® or 500 nM MLi-2 prior to recording. dLight expression is depicted in blue with Stim in dorsolateral STR. ii) Representative response to pulse train stimulation (10x10Hz with repeated 4x with increasing 11th recovery pulse interval). B-D dLight response parameters are shown separated by genotype in vehicle treatment and within genotypes by treatment condition. Statistics were performed using 2-way ANOVA on WT veh vs VKI veh vs WT MLi-2 vs VKI MLi-2 with relevant post-hoc comparisons. B i) dLight response size is significantly higher in VKI vs WT vehicle-treated brain slices (2-way ANOVA interaction p < 0.0001, genotype p = 0.003, Šídák’s multiple comparisons test @P1-P4 p < 0.05, P5 p = 0.06, P6-P10 p=ns). ii) dLight responses, when normalized to the first peak, are similar between VKI and WT vehicle-treated brain slices (2-way ANOVA interaction p < 0.0001, genotype p = 0.2393, Šídák’s multiple comparisons test @P1-P10 p=ns). iii) Recovery capacity following high frequency stimulation is significantly altered in VKI vs WT vehicle-treated brain slices (2-way ANOVA interaction p = 0.02, genotype p = 0.19, Šídák’s multiple comparisons test @500 ms p = 0.04, 1000–5000 ms p=ns). C i) dLight response peaks in WT brain slices are not altered with acute MLi-2 treatment (Šídák’s multiple comparisons test p=ns). ii) dLight responses normalized to the first peak are not altered with MLi-2 treament (Šídák’s multiple comparisons test p=ns). iii) Recovery after train stimulation is not altered with MLi-2 in WT brain slices (Šídák’s multiple comparisons test p=ns). D i) dLight response peaks in VKI brain slices are significantly reduced with MLi-2 treatment (Šídák’s multiple comparisons test @P1-P10 p < 0.05). ii) Normalized dLight responses in VKI brain slices are not altered with MLi-2 treatment (Šídák’s multiple comparisons test p=ns). iii) Recovery after train stimulation is not altered with MLi-2 treatment in VKI brain slices (Šídák’s multiple comparisons test p=ns). E Decay of pulse train response is not significantly different between VKI vs WT brain slices with vehicle or MLi-2 treatment (1-way ANOVA p = 0.21).

References

    1. Kordower, J. H. et al. Disease duration and the integrity of the nigrostriatal system in Parkinson’s disease. Brain136, 2419–2431 (2013). - PMC - PubMed
    1. Kim, H. J., Jeon, B. S. & Jenner, P. Hallmarks of Treatment Aspects: Parkinson’s Disease Throughout Centuries Including l -Dopa. in International Review of Neurobiology vol. 132 295–343 (Elsevier, 2017). - PubMed
    1. Fereshtehnejad, S.-M. et al. Evolution of prodromal Parkinson’s disease and dementia with Lewy bodies: a prospective study. Brain142, 2051–2067 (2019). - PubMed
    1. Kalia, L. V. & Lang, A. E. Parkinson’s disease. Lancet386, 896–912 (2015). - PubMed
    1. Goldman, J. G. & Postuma, R. Premotor and nonmotor features of Parkinson’s disease. Curr. Opin. Neurol.27, 434–441 (2014). - PMC - PubMed

LinkOut - more resources