. 2025 May 3;16(1):4128.
doi: 10.1038/s41467-025-59318-9.

Harnessing the FGFR2/NF2/YAP signaling-dependent necroptosis to develop an FGFR2/IL-8 dual blockade therapeutic strategy

Affiliations

Harnessing the FGFR2/NF2/YAP signaling-dependent necroptosis to develop an FGFR2/IL-8 dual blockade therapeutic strategy

Dongshao Chen et al. Nat Commun. .

Abstract

The multifaceted roles and mechanisms of necroptosis in cancer cells remain incompletely understood. Here, we demonstrate that FGFR2 inhibition potently inhibits esophageal squamous cell carcinoma (ESCC) by inducing necroptosis in a RIP1/MLKL-dependent manner and show RIP3 is dispensable in this pathway. Notably, MST1 is identified as a necroptotic pathway component that interacts with RIP1 and MLKL to promote necroptosis by phosphorylating MLKL at Thr216. Additionally, FGFR2 inhibition induces Ser518 phosphorylation and triggers ubiquitin-mediated degradation of NF2, culminating in Hippo pathway suppression. Subsequently, YAP activation promotes RIP1 and MLKL transcriptional upregulation, further amplifying necroptosis. Intriguingly, IL-8 derived from necrotic cells stimulates peripheral surviving tumor cells to increase PD-L1 expression. Dual blockade of FGFR2/PD-L1 or FGFR2/IL-8-CXCR1/2 robustly impedes tumor growth in humanized mouse xenografts. Collectively, our findings delineate an alternative FGFR2-NF2-YAP signaling-dependent necroptotic pathway and shed light on the immunoregulatory role of FGFR2, offering promising avenues for combinatorial therapeutic strategies in clinical cancer management.


Conflict of interest statement

Competing interests: The authors declare no competing interests.

Figures
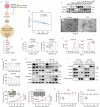
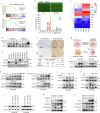
Fig. 1
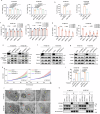
Fig. 1. FGFR inhibitor induces necroptosis in ESCC.
a Diagram illustrating candidate genes regulating necroptosis in ESCC. Icons of this figure created in BioRender. Chen, D. (2025) https://BioRender.com/gvkj9ea. b Inverse correlation between FGFR2 and MLKL expression in ESCC (TCGA data). c Protein expression levels of FGFR2 and MLKL in esophageal cell lines. d Transmission electron microscopy of the KYSE140 cells treated for 12 h with DMSO or 10 μM AZD4547. Yellow arrowheads denote loosened nuclei. Red arrowheads indicate swelled cellular organelles. Blue arrowheads indicate plasma membrane rupture. Scale bar: 2 μm. e LDH release as a measure of cellular necroptosis post-AZD4547 treatment for 24 h. n = 3 biological replicates. f FACS analysis of Fluo4 fluorescent cells following 40 μM AZD4547 treatment for 24 h. g Cells were exposured to 40 μM AZD4547 or 0.3 mM EGTA for 24 h to determine the cell survival. n = 4 biological replicates. h Immunoblotting analysis post-24 h AZD4547 treatment. i Immunoblotting of membrane-cytosolic extracts following 24 h AZD4547 treatment. C cytoplasm, M membrane. j AZD4547 (12.5 mg/kg/d, by oral gavage) was given to mice bearing KYSE180 cells xenografts (n = 5 per group) or to PDX_ES0136 models (n = 6 per group) for 14 days. k Mice weights were measured every three days or twice weekly after treatment. All data are mean ± SD. Statistical analyses were performed using one-way ANOVA with multiple comparisons (e, g) or two-way ANOVA with multiple comparisons (j). Source data are provided as a Source Data file.
Fig. 2
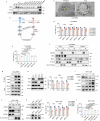
Fig. 2. FGFR2-mediated necroptosis is RIP1 and MLKL-dependent.
a KYSE140 and KYSE180 cells were treated with 40 μM AZD4547 in the absence or presence of 30 μM Nec-1, 5 μM NSA, 20 μM ZVAD and 1 μM Fer-1 for 24 h to assay cell viability. b The release of LDH was detected following AZD4547 with Nec-1 and NSA for 24 h. c, d Knockdown of RIP1 and MLKL inhibited AZD4547-induced cell death (c) and LDH release (d). The p value was derived from a comparison with the control group. eg Cells were transfected with FGFR2 (e), FGFR1 (f) or FGFR3 (g) siRNAs, and whole-cell lysates were subjected to western blot analysis after 48 h. pMLKL was induced by adding 20 μM AZD4547. h Cells were analyzed for proliferation by a real-time cell analyzer (RTCA)-MP system. i Knockdown of FGFR2 inhibited 10 μg/mL cisplatin-induced LDH release. j Transmission electron microscopy of the KYSE140 and KYSE180 cells transfected with FGFR2 siRNAs for 48 h. Yellow arrowheads denote loosened nuclei. Red arrowheads indicate swelled cellular organelles. Blue arrowheads indicate plasma membrane rupture. Green arrowheads indicate vacuolization. Scale bar: 2 μm. k After 48 h transfection with FGFR2 siRNA, membrane-cytosolic extraction proteins were measured using western blot. ns not significant. All data are mean ± SD from n = 3 (b, d), 4 (c, i) or 5 (a) biological replicates. Statistical analyses were performed using one-way ANOVA with multiple comparisons. Source data are provided as a Source Data file.
Fig. 3
Fig. 3. RIP3 is dispensable in FGFR2 inhibition-induced necroptosis.
a Western blot analysis of RIP1 and RIP3 expression of esophageal cell lines. b Schematic of the molecules participated in necroptosis under various conditions. Created in BioRender. Chen, D. (2025) https://BioRender.com/ukteuom. c Transmission electron microscopy of the COLO680N cells treated for 12 h with DMSO or 10 μM AZD4547. Yellow arrowheads denote loosened nuclei. Red arrowheads indicate swollen cellular organelles. Blue arrowheads show plasma membrane rupture. Scale bar: 2 μm. d Following transfection with RIP1, RIP3 or MLKL siRNA for 48 h, cell viability was determined after treatment with AZD4547 for another 24 h. The p value was derived from a comparison with the control group. e Cells were treated with 40 μM AZD4547 ± 30 μM Nec-1, 5 μM NSA, 20 μM ZVAD and 1 μM Fer-1 for 24 h to assay cell viability. f Cells were transfected with RIP3 siRNAs for 48 h following AZD4547 treatment for another 24 h and membrane-cytosolic extraction was analyzed by immunoblotting. g Immunoprecipitation assay for MLKL binding to RIP1 and RIP3 post-AZD4547 treatment (40 μM). h Indicated L929s were treated with 10 μM AZD4547 for 24 h, and then cell viability was assayed. The p value was derived from a comparison with the WT group. i Immunoblotting of indicated proteins in L929 RIP3/ cells following treatment with AZD4547 (0.1–10 μM) for 24 h. j Cells were treated with 1 μM AZD4547 for 24 h and indicated proteins of membrane-cytosolic extraction were analyzed by immunoblotting. k Following transfection with RIP1 and MLKL siRNA for 48 h, 10 μM AZD4547 was added for subsequent 24 h to assay cell viability. The p value was derived from a comparison with the control group. l Cells were treated with AZD4547 with or without Nec-1, NSA, ZVAD, and Fer-1 for 24 h to assay cell viability. ns not significant. All data are mean ± SD from n = 4 (k, l) or 5 (d, e, h) biological replicates. Statistical analyses were performed using one-way ANOVA with multiple comparisons. Source data are provided as a Source Data file.
Fig. 4
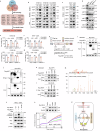
Fig. 4. MST1 is a component of necroptotic pathway in RIP3-deficient cells.
a Identification of MST1 through the IID database as one of 24 proteins interacting with RIP1 and MLKL, but not RIP3. b, c Immunoprecipitation and immunoblotting analyses show MST1 complex formation with RIP1 and MLKL following AZD4547 treatment in ESCC (40 μM) and RIP3−/− L929 (10 μM) cells. dg Cell viability assays post-MST1 siRNA knockdown and subsequent AZD4547 exposure. The p value was derived from a comparison with the control group. h Structure of wild-type MST1 and mutant derivates. i Lysates of HEK293T cells transfected with the Myc-RIP1 alone or together with indicated plasmid, were immunoprecipitated with Flag antibody and analyzed by immunoblotting against Myc antibody. j Lysates of HEK293T cells transfected with the Myc-MLKL alone or together with indicated plasmid, were immunoprecipitated with Myc antibody and analyzed by immunoblotting against Flag antibody. k Lysates of HEK293T cells transfected with the Flag-MST1 alone or together with indicated plasmids were immunoprecipitated and analyzed as in (i). l Lysates of HEK293T cells transfected with the Myc-MLKL alone or together with indicated plasmids were immunoprecipitated and analyzed as in (j). m Mass spectrometry peak photographs showing the phosphorylation at the MLKL T216 site. n Flag-MST1 and MLKL-WT or MLKL-T216A were co-expressed in MLKL/− L929 cells, followed by treatment with 20 μM AZD4547. The migration shift of MLKL was then analyzed using Phos-tag gel electrophoresis. o Cells were transfected with MLKL-WT or MLKL mutant plasmids and analyzed for proliferation by a real-time cell analyzer (RTCA)-MP system. p Schematic illustrating the molecular participants in FGFR2 inhibition-induced necroptosis under varying conditions. Icons of this figure created with BioRender.com. All data are mean ± SD from n = 4 biological replicates. Statistical analyses were performed using one-way ANOVA with multiple comparisons. Source data are provided as a Source Data file.
Fig. 5
Fig. 5. MST1-mediated necroptosis is dependent on the Hippo pathway.
a Western blot analysis of indicated proteins post-AZD4547 treatment (40 μM) in KYSE140 and KYSE180 cells. b, c. Analysis of LATS1 and LATS2 siRNAs impacts on protein expression. d Indicated proteins expression in YAP overexpressed cells. e Reduced RIP1 and MLKL expression following YAP deletion. f Knockdown of YAP inhibited AZD4547 (40 μM, 24 h)-induced cell death. The p value was derived from a comparison with the control group. g Nuclear-cytosolic protein analysis post-AZD4547 treatment (40 μM). C cytoplasm. N nucleus. h Protein level in cells transfected with wild-type YAP and kinase-inactive YAP mutants (S127A, S397A) for 48 h. i RIP1 and MLKL transcriptional activity in vector and YAP-overexpressed cells were measured by a luciferase assay. j RIP1 and MLKL transcriptional activity in control and siYAP cells were measured by a luciferase assay. k, l ChIP-qPCR assessing TEAD4 (k) or YAP (l) binding to RIP1 and MLKL promoters using control IgG or indicated antibody. m Proposed model for FGFR2-Hippo signaling-mediated necroptosis. Created in BioRender. Chen, D. (2025) https://BioRender.com/n9ng3qk All data are mean ± SD from n = 3 (i, j, k, l) or 4 (f) biological replicates. Statistical analyses were performed using one-way ANOVA with multiple comparisons (f, i, j) or two-tailed unpaired Student’s t-test (k, l). Source data are provided as a Source Data file.
Fig. 6
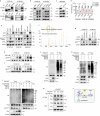
Fig. 6. FGFR2 inhibition modulates the Hippo pathway by promoting NF2 ubiquitination.
a Immunoblot analyses of lysates following binding with antibodies against FGFR2 and NF2 showed association between them. b, c Analysis of the impact of NF2 deletion on protein expression. d Knockdown of YAP increased AZD4547-induced cell death (10 μM in HEK293A cells, 20 μM in ESCC cells). The p value was derived from a comparison with the control or WT group. e Western blotting results exhibiting the protein levels of indicted molecules after re-expressing NF2 in NF2-deleted cells. f Mass spectrometry did not identify a phosphorylation site on NF2. g Increased pNF2 expression following FGFR2 deletion (Induction by adding 20 μM AZD4547). h and i pNF2 levels post-AZD4547 treatment at various concentrations and indicated times. j–l HEK293T cells were co-transfected with indicated plasmids. After 36 h, cells were treated with 10 μM MG132 (j and l) or together with 20 μM AZD4547 (k) for 12 h. Cell lysates were immunoprecipitated with a flag antibody, followed by immunoblotting with an HA antibody to detect ubiquitinated NF2. m HEK293T cells were co-transfected with Myc-FGFR2 and NF2-WT or NF2-S518A and immunoprecipitated with a Flag antibody to detect the binding affinity between FGFR2 and NF2. n Diagram of the relationship between FGFR2 and NF2 in the presence of AZD4547. Created in BioRender. Chen, D. (2025) https://BioRender.com/mpyjqz3. All data are mean ± SD from n = 6 biological replicates. Statistical analyses were performed using two-tailed unpaired Student’s t-test. Source data are provided as a Source Data file.
Fig. 7
Fig. 7. FGFR2 inhibition increases PD-L1 expression in ESCC via IL-8 secretion.
a GSEA of sequencing data highlighting significant pathways in AZD4547-treated (40 μM) cells. b Cytokine analysis in medium from AZD4547-treated KYSE140 cells, highlighting the significantly increased cytokine (red box). Concentration of cytokines were shown on the bottom. c Differential expression of inflammation-related cytokines between control and AZD4547-treated groups. d Upregulated PD-L1 protein levels post-AZD4547 treatment. e Expression levels of MLKL and PD-L1 in ESCC cell lines. f MLKL and PD-L1 expression in ESCC tissue microarrays. Scale bar, 200 μm. The correlation was shown in table. g PD-L1 expression analysis in cells cultured with supernatant from AZD4547-treated cells (40 μM). Created in BioRender. Chen, D. (2025) https://BioRender.com/qkttth3. h, i PD-L1 levels post-IL-8 treatment at various concentrations and indicated time. j Western blot analysis of PD-L1 in cells treated with AZD-CM and 1 μg/mL IL-8 antibody. k Western blot analysis of PD-L1 in cells treated with 50 ng/mL IL-8 and 1 μg/mL IL-8 antibody. l PD-L1 expression analysis in cells cultured with the AZD4547-conditioned medium from the IL-8 knockdown or control groups. m, n Protein expression analysis following treatment with AZD-CM (m) or 50 ng/mL IL-8 (n). AZD-CM: AZD4547-conditioned medium. All data are mean ± SD from n = 4 biological replicates. Source data are provided as a Source Data file.
Fig. 8
Fig. 8. Synergistic effects of dual inhibition of FGFR and PD-L1 in ESCC xenografts.
a Curves showing the xenografts growth of humanized mice bearing KYSE150 cells treated with vehicle control, AZD4547 (12.5 mg/kg/d, by oral gavage), Atezolizumab (5 mg/kg, twice weekly, i.p.), Reparixin (30 mg/kg/d, i.p.), AZD4547 (12.5 mg/kg/d) plus Atezolizumab (5 mg/kg), AZD4547 (12.5 mg/kg/d) plus Reparixin (30 mg/kg/d), or Reparixin (30 mg/kg/d) plus Atezolizumab (5 mg/kg) for 14 days. n = 5 per group. Tumor volumes and mice weights were measured every three days after treatment, and the curves were expressed as mean ± SD. The corresponding TGI were listed. *p < 0.05 by repeated-measures ANOVA. TGI tumor growth inhibition. b Tumors were weighted after removal. c H-scores of Ki67, FGFR2, PD-L1, IL-8, YAP, MLKL, CD3, and granzyme B in xenograft tissues. d Schematic of molecular mechanisms involved in FGFR2 inhibition-induced necroptosis. Created in BioRender. Chen, D. (2025) https://BioRender.com/1wbwjd2. Other data are mean ± SD from n = 3 biological replicates. Statistical analyses were performed using one-way ANOVA with multiple comparisons (b, c) or two-way ANOVA with multiple comparisons (a). Source data are provided as a Source Data file.

References

    1. Chen, W. et al. Cancer statistics in China, 2015. CA Cancer J. Clin.66, 115–132 (2016). - PubMed
    1. Pennathur, A. et al. Oesophageal carcinoma. Lancet381, 400–412 (2013). - PubMed
    1. Chen, D., Yu, J. & Zhang, L. Necroptosis: an alternative cell death program defending against cancer. Biochim. Biophys. Acta1865, 228–236 (2016). - PMC - PubMed
    1. Cai, Z. et al. Plasma membrane translocation of trimerized MLKL protein is required for TNF-induced necroptosis. Nat. Cell Biol.16, 55–65 (2014). - PMC - PubMed
    1. Chen, X. et al. Translocation of mixed lineage kinase domain-like protein to plasma membrane leads to necrotic cell death. Cell Res.24, 105–121 (2014). - PMC - PubMed

MeSH terms