. 2025 May 3;15(1):15546.
doi: 10.1038/s41598-025-00465-w.

Huntingtin inclusion bodies have distinct immunophenotypes and ubiquitination profiles in the Huntington's disease human cerebral cortex

Affiliations

Huntingtin inclusion bodies have distinct immunophenotypes and ubiquitination profiles in the Huntington's disease human cerebral cortex

Molly E V Swanson et al. Sci Rep. .

Abstract

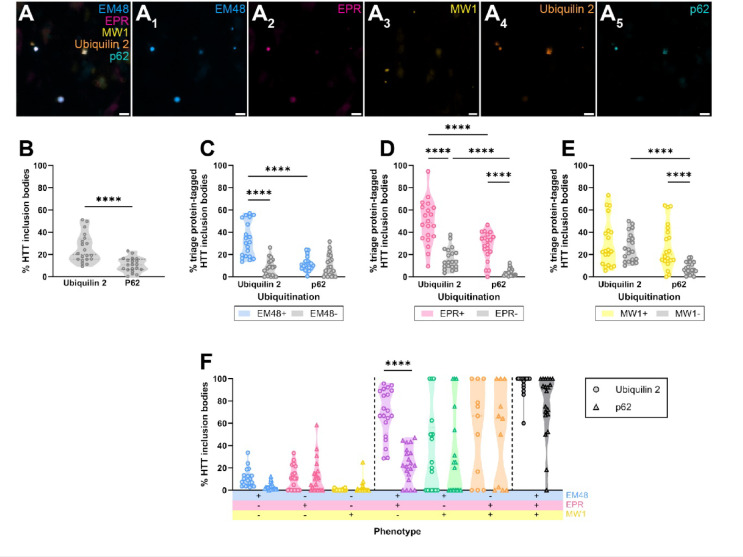
Huntington's disease (HD) is a hereditary neurodegenerative condition caused by a CAG repeat expansion mutation in the gene encoding the huntingtin (HTT) protein. The accumulation of HTT inclusion bodies is a pathological hallmark of HD and a common target for therapeutic strategies. However, the limited efficacy of treatments targeting the HTT protein highlights the need for a better understanding of the role of HTT inclusion bodies in HD pathogenesis. This study examined the heterogeneity of HTT inclusion body composition by co-labelling with three HTT epitope-specific antibodies to characterize HTT inclusion body 'immunophenotype'. We then characterized the size and sub-cellular location of HTT inclusions with distinct immunophenotypes. Using multiplex immunohistochemistry, we also examined the ubiquitination profile of each immunophenotype. Our findings demonstrate that HTT inclusions have a range of immunophenotypes, with some labelled by only one of the three antibodies and others exhibiting co-labelling by several antibodies, thus demonstrating the heterogeneity in inclusion composition and structure. We outline evidence that inclusion bodies exclusively labelled with the EM48 antibody are small, non-nuclear, and more abundant in HD cases with increased CAG repeat length, higher Vonsattel grade, and earlier age of onset. We also find that HTT inclusion bodies labelled by multiple antibodies are more likely to be ubiquitinated, predominantly by K63- rather than K48-linked ubiquitin, suggesting preferential degradation by autophagy. Lastly, we show that ubiquitinated HTT inclusion bodies are more highly immunoreactive for ubiquilin 2 than p62. Our findings highlight the need for multiple antibodies to capture the full spectrum of HTT pathology in HD and imply that future studies should consider the diversity of inclusion body composition and structure when correlating pathology formation to neurodegeneration, clinical symptoms, or disease severity.


Conflict of interest statement

Declarations. Competing interests: The authors declare no competing interests. Ethics approval and consent to participate: The tissue was donated with written informed consent from the donor and family before brain removal. All research procedures and protocols were approved by the Health and Disability Ethics Committee (Ref.14/NTA/208). Consent for publication: Written informed consent to publish anonymised data pertaining to tissue donors was obtained from next of kin at the time of tissue donation. All research procedures and protocols were approved by the Health and Disability Ethics Committee (Ref.14/NTA/208).

Figures

Fig. 1
Fig. 1
Immunohistochemical profiling of HTT inclusion body ubiquitination and associated triage protein binding in the HD human middle temporal gyrus. Multiplexed immunohistochemical approaches were used to identify HTT inclusion bodies, ubiquitin species, and triage proteins in neurologically normal and HD human middle temporal gyrus tissue microarray cores. Example images from HD case, HC150, are shown. HTT inclusion body antibodies, EM48 (A), EPR (B), and MW1 (C), were used for labelling together with antibodies for pan-ubiquitin (D), K48- and K63-linked polyubiquitination (E and F), p62 (G), and ubiquilin 2 (H), with a Hoechst nuclear counterstain (I); scale bars = 20 μm.
Fig. 2
Fig. 2
EM48+, EPR+, and MW1 + HTT inclusion bodies are increased in the HD middle temporal gyrus. Immunohistochemical labelling was used to visualise HTT inclusion bodies using EM48, EPR, and MW1 antibodies. A representative image of an EM48 + EPR + MW1 + HTT inclusion body from HD case, HC145, is shown (A); scale bars = 10 μm. For quantification, total HTT inclusion bodies were identified by creating separate HTT inclusion body masks from EM48, EPR, and MW1 immunolabelling, which were combined to create an HTT inclusion body master mask. Each object within the HTT inclusion body master mask was considered a single HTT inclusion body and may be labelled with any combination of the three antibodies (EM48+, EPR + or MW1+) (B). An inclusion body was classified with an EM48+, EPR + or MW1 + phenotype if the maximum intensity for the respective immunolabel was above a manually determined threshold for each case (B); created in BioRender. The density of total HTT inclusion bodies (C), EM48+ (D), EPR+ (E), and MW1+ (F) HTT inclusion bodies were compared between neurologically normal and HD cases using unpaired t-tests. Data presented as mean ± SD; normal n = 22 and HD n = 20. The percentage of HTT inclusion bodies with each possible combination of EM48, EPR, and MW1 labelling was calculated for each HD case (G). Data are presented as truncated violin plots (n = 20). The percentage of HTT inclusion bodies identified as each EM48, EPR, and MW1 +/- phenotype was compared between HD cases with a CAG repeat length of less than or greater than 43 (H), with an age of onset of less than or greater than 40 (I), and with a Vonsattel grade of 1–2 and 3–4 (J) using a Chi-square analysis. Data presented as stacked bar graphs representing all HTT inclusion bodies from all HD cases.
Fig. 3
Fig. 3
EM48 + only HTT inclusion bodies are smaller than other EM48-EPR-MW1 immunophenotypes and are predominantly non-nuclear in localisation. The size of each HTT inclusion body was determined and plotted as single-cell data on distribution graphs (AD) and case-mean data on truncated violin plots (EH, n = 20 cases) to compare the size between EM48 + and EM48- inclusions (A and E), EPR + and EPR- inclusions (B and F), MW1 + and MW1- inclusions (C and G), and each EM48-EPR-MW1 phenotype (D and H). HTT inclusion bodies were noted to be both nuclear and non-nuclear; representative images of nuclear (I) and non-nuclear (J) HTT inclusion bodies from representative HD case, HC134, with EM48, EPR, and MW1 immunoreactivities are shown; scale bars = 20 μm. The percentage of EM48 + and EM48- inclusions (K), EPR + and EPR- inclusions (L), MW1 + and MW1- inclusions (M), and each HTT inclusion body EM48, EPR, and MW1 phenotype identified within a nucleus was determined per HD case (n = 20). The mean HTT inclusion size and percentage of nuclear HTT inclusion bodies per case were compared between EM48+/-, EPR +/-, and MW1+/- inclusion groups using a Wilcoxon matched-pairs signed rank test and between each EM48, EPR, and MW1 +/- phenotype for HD cases using a mixed-effects analysis, with Geisser-Greenhouse correction and Tukey’s multiple comparisons test. Statistical significance of differences shown for E-G and K-M: ** p ≤ 0.01, *** p ≤ 0.001, **** p ≤ 0.0001. Statistical significance for H and N are shown in Supplementary Table 2.
Fig. 4
Fig. 4
HTT inclusion bodies are not frequently ubiquitinated, but when ubiquitinated, are predominantly ubiquitinated by K63-linked ubiquitin. Immunohistochemical labelling revealed that EM48, EPR, and/or MW1 HTT inclusion bodies were ubiquitinated by K48- and/or K63-linked ubiquitin (A); a representative image of K48- and K63-ubiquitinated HTT inclusion bodies from HD case, HC145, is shown; scale bars = 10 μm. The ubiquitination status of each HTT inclusion body was determined by labelling for pan-, K48-, and K63-linked ubiquitin, where positive labelling was identified if the maximum intensity was above manually determined thresholds. The percentage of EM48 + versus EM48- (B), EPR + versus EPR- (C), and MW1 + versus MW1- (D) HTT inclusion bodies that were ubiquitinated (either pan, K48-, and/or K63-linked) were compared using a Wilcoxon matched-pairs signed rank test. The percentage of ubiquitinated HTT inclusion bodies was determined for each EM48, EPR, and MW1 +/- phenotype per HD case (E), and compared between phenotypes using a mixed-effects analysis, with Geisser-Greenhouse correction and Tukey’s multiple comparisons test. The percentage of ubiquitinated HTT inclusion bodies ubiquitinated by K48- versus K63-linked ubiquitin was compared using a Wilcoxon matched-pairs signed rank test (F). The percentage of ubiquitinated EM48 + versus EM48- (G), EPR + versus EPR- (H), and MW1 + versus MW1- (I) HTT inclusion bodies ubiquitinated by K48- versus K63-linked ubiquitin were compared using an ordinary two-way ANOVA with Tukey’s multiple comparisons test. The percentage of EM48, EPR, and MW1 +/- immunophenotypes HTT inclusion bodies identified as being ubiquitinated by K48- or K63-linked chains were compared using an ordinary two-way ANOVA with Sidak’s multiple comparisons test (J). Data are presented as truncated violin plots (n = 20). Statistical significance of differences shown for B-D and F-J: * p ≤ 0.05, ** p ≤ 0.01, *** p ≤ 0.001, **** p ≤ 0.0001. Statistical significance for E is shown in Supplementary Table 3.
Fig. 5
Fig. 5
Ubiquitinated HTT inclusion bodies are more highly tagged by ubiquilin 2 than p62. Immunohistochemical labelling revealed that EM48, EPR, and/or MW1 HTT inclusion bodies were tagged by triage proteins, ubiquilin 2 and/or p62 (A); a representative image of ubiquilin 2- and/or p62-tagged HTT inclusion bodies from HD case, HC145, is shown; scale bars = 10 μm. The tagged triage protein status of each ubiquitinated HTT inclusion body was determined by labelling for ubiquilin 2 and p62, where positive labelling was identified if the maximum intensity was above manually determined thresholds. The percentage of ubiquitinated HTT inclusion bodies tagged by ubiquilin 2 versus p62 was compared using a Wilcoxon matched-pairs signed rank test (B). The percentage of EM48 + versus EM48- (C), EPR + versus EPR- (D), and MW1 + versus MW1- (E) HTT inclusion bodies tagged by ubiquilin 2 or p62 were compared using an ordinary two-way ANOVA with Tukey’s multiple comparisons test. The percentage of EM48, EPR, and MW1 +/- immunophenotyped HTT inclusion bodies tagged by ubiquilin 2 or p62 were compared using an ordinary two-way ANOVA with Sidak’s multiple comparisons test (F). Data presented as truncated violin plots (n = 20 cases). Statistical significance of differences: *** p ≤ 0.001, **** p ≤ 0.0001.
Fig. 6
Fig. 6
Summary of HTT inclusion body characteristics. Heatmap organised by HTT inclusion body phenotype, with each column representing a single case and each bar coloured according to that case’s value for the characteristic outlined by the row title (A). Schematic illustrating the general characteristics of each HTT inclusion body phenotype: (1) EPR + MW1 + inclusion bodies are more frequently located in the nucleus compared to other phenotypes, (2) HTT inclusion bodies that label for more than one epitope-specific antibody are more frequently ubiquitinated, and that ubiquitination occurs more frequently by K63- compared to K48-linked ubiquitin chains, (3) Ubiquitinated HTT inclusion bodies are more frequently tagged by ubiquilin 2 than p62 (B). Schematic summarising our hypothesis of HTT inclusion body immunophenotype, ubiquitination, and triage protein tagging with increasing HD severity (C); created in BioRender.

References

    1. Martin, J. B. & Gusella, J. F. Huntington’s disease. Pathogenesis and management. N. Engl. J. Med.315 (20), 1267–1276 (1986). - PubMed
    1. MacDonald, M. E. et al. A novel gene containing a trinucleotide repeat that is expanded and unstable on Huntington’s disease chromosomes. Cell72 (6), 971–983 (1993). - PubMed
    1. Herndon, E. S. et al. 3rd. Neuroanatomic profile of polyglutamine immunoreactivity in huntington disease brains. J. Neuropathol. Exp. Neurol.68 (3), 250–261 (2009). - PMC - PubMed
    1. Kim, E. H. et al. Cortical interneuron loss and symptom heterogeneity in huntington disease. Ann. Neurol.75 (5), 717–727 (2014). - PubMed
    1. Mehrabi, N. F. et al. Symptom heterogeneity in Huntington’s disease correlates with neuronal degeneration in the cerebral cortex. Neurobiol. Dis.96, 67–74 (2016). - PubMed