. 2025 May 3;8(1):241.
doi: 10.1038/s41746-025-01632-z.

Latent retinal structural patterns with aging

Affiliations

Latent retinal structural patterns with aging

Kei Sano et al. NPJ Digit Med. .

Abstract

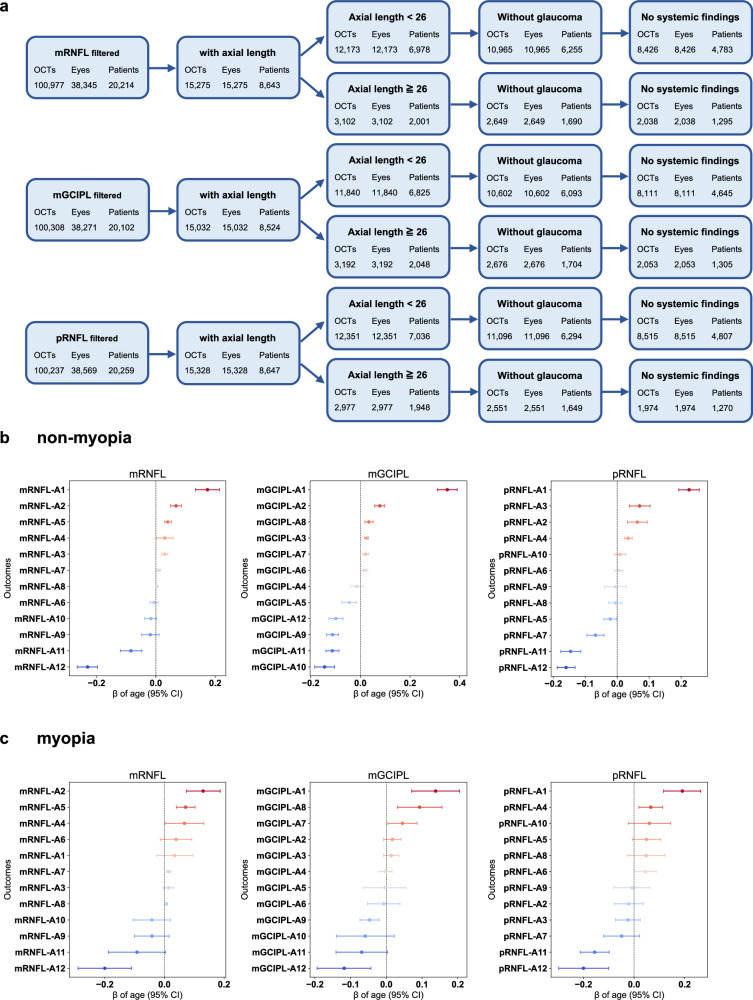
Optical coherence tomography (OCT) is an efficient tool for non-invasively evaluating retinal structures. Retinal thinning changes assessed using OCT are recognized as potential biomarkers for systemic conditions such as Alzheimer's disease, Parkinson's disease, and chronic kidney disease. However, age-related retinal changes remain largely unexplored, complicating the differentiation between physiological and pathological alterations. Here, we introduced a highly granular approach to assess age-related spatial changes in the inner retina using latent retinal archetypes, identifying 36 retinal archetypes of macula and peripapillary sector images from 189,387 OCTs of 22,494 individuals. Subsequently, we evaluated the associations between these archetypes and age; age-related archetypes are characterized by total or superior thinning in the macula sector. Among individuals with myopia, the inferior thinning pattern in the macula ganglion cell-inner plexiform layer was associated with aging. The age-related effects in the peripapillary sector were primarily reflected in the shape of retinal artery trajectories. Overall, latent retinal archetypes would offer new avenues for the effective utilization of retinal biomarkers in age-related diseases.


Conflict of interest statement

Competing interests: The authors declare no competing interests.

Figures

Fig. 1
Fig. 1. Participants inclusion flowchart and overviews of data processing.
a VAE model architecture for reconstructing OCT images based on latent variables (Z) derived from OCT features. b Overview of latent archetype generation through archetypal analysis applied to latent OCT features (Z). c Participants inclusion flowchart in the training and test datasets for mRNFL, mGCIPL, and pRNFL images. VAE variational autoencoder, OCT optical coherence tomography, mRNFL macula retinal nerve fiber layer, mGCIPL macula ganglion cell–inner plexiform layer, pRNFL peripapillary retinal nerve fiber layer.
Fig. 2
Fig. 2. Latent retinal archetypes trained on filtered OCT data.
a In total, 12 retinal archetypes of mRNFL colored according to retinal layer thickness. b Retinal archetypes of mGCIPL colored according to retinal layer thickness. c Retinal archetypes of pRNFL colored according to retinal layer thickness. OCT optical coherence tomography, mRNFL macula retinal nerve fiber layer, mGCIPL macula ganglion cell–inner plexiform layer, pRNFL peripapillary retinal nerve fiber layer.
Fig. 3
Fig. 3. Associations between the retinal structure of OCT and aging.
a Association between retinal thickness and age (per decade). b Association between retinal archetypes and age, adjusted for mean retinal thickness and sex using GEE. c Statistical significance of the association between retinal archetypes and age (α = 0.001). OCT optical coherence tomography, mRNFL macula retinal nerve fiber layer, mGCIPL macula ganglion cell–inner plexiform layer, pRNFL peripapillary retinal nerve fiber layer, GEE generalized estimating equation.
Fig. 4
Fig. 4. Sensitivity analyses stratified by glaucoma and systemic findings.
a Participants inclusion flowchart in sensitivity analyses of glaucoma and systemic findings. b Association between retinal archetypes and age, adjusted for mean retinal thickness and sex using GEE, among subjects without glaucoma and systemic findings. OCT optical coherence tomography, mRNFL macula retinal nerve fiber layer, mGCIPL macula ganglion cell–inner plexiform layer, pRNFL peripapillary retinal nerve fiber layer, HbA1c hemoglobin A1c, eGFR estimated glomerular filtration rate, GEE generalized estimating equation.
Fig. 5
Fig. 5. Sensitivity analyses stratified by myopic status (axial length).
a Participants inclusion flowchart in sensitivity analyses of axial length (myopia status). b Association between retinal archetypes and age, adjusted for mean retinal thickness and sex using GEE, among non-myopia subjects. c Association between retinal archetypes and age, adjusted for mean retinal thickness and sex using GEE, among myopia subjects only. OCT optical coherence tomography, mRNFL macula retinal nerve fiber layer, mGCIPL macula ganglion cell–inner plexiform layer, pRNFL peripapillary retinal nerve fiber layer, GEE generalized estimating equation.
Fig. 6
Fig. 6. Associations between retinal archetypes.
a Participants inclusion flowchart of patients with all OCT layers. b Circos plots illustrating interrelationships among retinal structural patterns. c Case study showcasing superior thinning retinal pattern. d Case study showcasing inferior thinning retinal pattern. e Case study of a clockwise rotational retinal pattern (without thinning). f Case study of normal retinal pattern. OCT optical coherence tomography, mRNFL macula retinal nerve fiber layer, mGCIPL macula ganglion cell–inner plexiform layer, pRNFL peripapillary retinal nerve fiber layer.
Fig. 7
Fig. 7. External validation using the Harvard GDP dataset.
a Original OCT images were downsampled to 26×26 pixels using Lanczos interpolation. b All Harvard GDP OCT images were used for both fine-tuning and latent feature extraction with the VAE model. After excluding abnormal OCT images, latent retinal archetypes were generated using the AA model. c 12 retinal archetypes of the pRNFL derived from the Harvard GDP dataset. d Associations between retinal archetypes and age, adjusted for mean retinal thickness and sex using GEE models. OCT optical coherence tomography, Harvard GDP Harvard glaucoma detection and progression dataset, VAE variational autoencoder, pRNFL peripapillary retinal nerve fiber layer.

References

    1. Xie, J. S., Donaldson, L. & Margolin, E. The use of optical coherence tomography in neurology: a review. Brain145, 4160–4177 (2022). - PubMed
    1. Chan, V. T. T. et al. Spectral-domain OCT measurements in Alzheimer’s disease: a systematic review and meta-analysis. Ophthalmology126, 497–510 (2019). - PMC - PubMed
    1. Ito, Y. et al. Quantitative assessment of the retina using oct and associations with cognitive function. Ophthalmology127, 107–118 (2020). - PubMed
    1. Costanzo, E. et al. Ocular biomarkers for alzheimer disease dementia: an umbrella review of systematic reviews and meta-analyses. JAMA Ophthalmol.141, 84–91 (2023). - PubMed
    1. Satue, M. et al. Retinal thinning and correlation with functional disability in patients with Parkinson’s disease. Br. J. Ophthalmol.98, 350–355 (2014). - PubMed

LinkOut - more resources