. 2025 May 3;15(1):15506.
doi: 10.1038/s41598-025-99896-8.

Computerised decision support system towards informing Lyme borreliosis incidence in France

Affiliations

Computerised decision support system towards informing Lyme borreliosis incidence in France

Ilona Eveline Suhanda et al. Sci Rep. .

Abstract

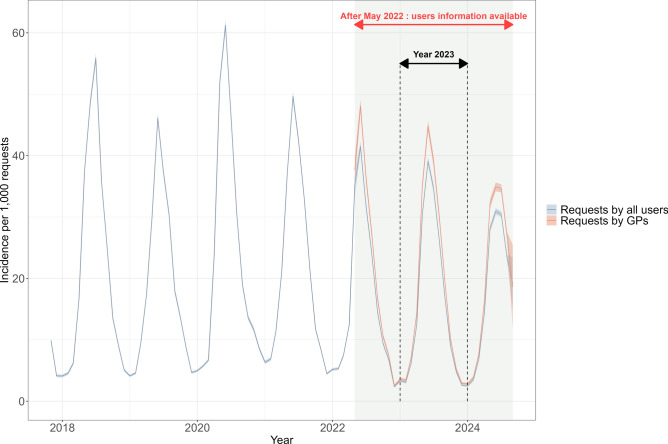
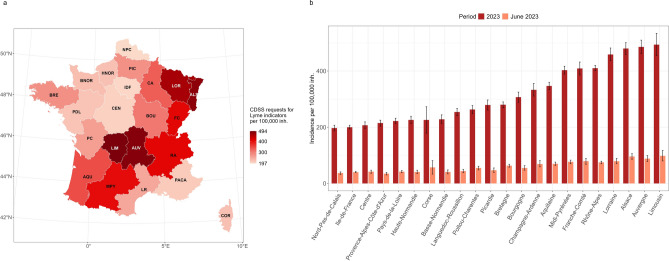
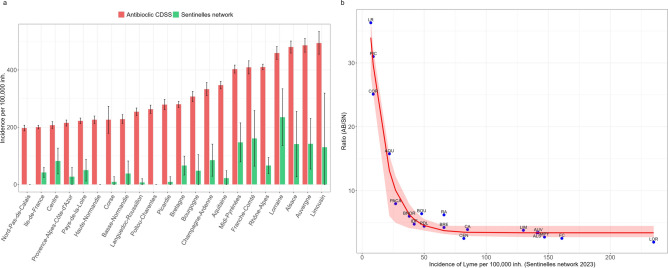
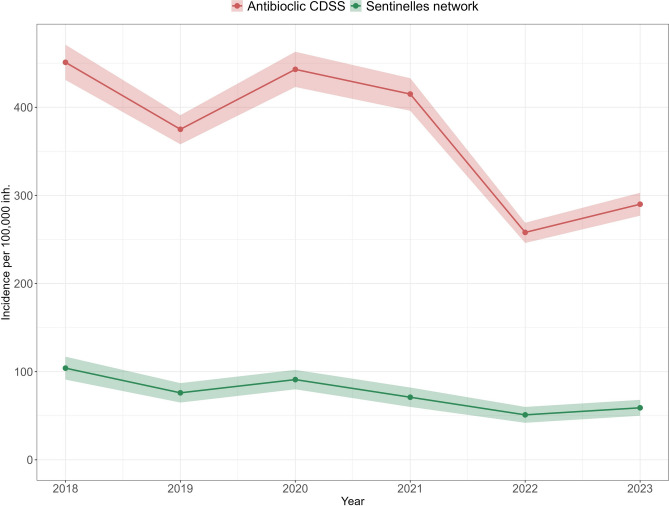
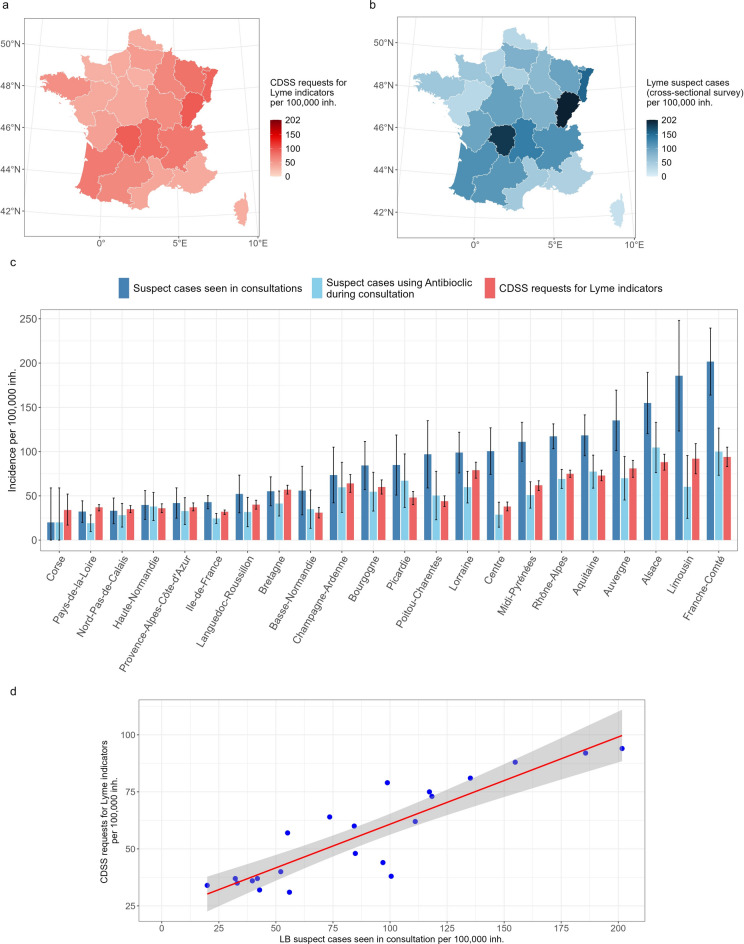
In Europe, the estimation of Lyme borreliosis (LB) incidence is challenged by its heterogeneous reporting. In France, LB incidence is estimated from cases reported voluntarily to the Sentinelles network through general practitioners (GPs). Here, we explored how a computerised decision support system (CDSS), Antibioclic, with higher GPs participation and country-wide coverage, can inform further LB incidence. We derived the incidence of LB Antibioclic indicators (with either erythema migrans or disseminated disease), surveyed Antibioclic usage for suspect cases seen in GP consultations, and compared those estimates with the Sentinelles network estimations. In 2023, the incidence of Antibioclic LB indicators (290 per 100,000 inhabitants; CI95%, 277-303) was almost five times higher than LB incidence from the Sentinelles network, but sharing similar higher-incidence regions. Antibioclic LB indicators under-estimated the incidence of suspect cases seen in higher-incidence regions, while in lower-risk regions, Antibioclic estimation was closer to observed suspect cases. Refine estimates would benefit from improved follow up over time and space while improving case definition.

Keywords: Computerised decision support system (CDSS); Incidence estimation; Lyme borreliosis; Spatial analysis.


Conflict of interest statement

Declarations. Competing interests: Raphaëlle Métras is an Editorial Board Member in a nature portfolio journal (Communications Medicine). All other authors declare no financial or non-financial competing interests.

Figures

Fig. 1
Fig. 1
Monthly incidence estimation of Antibioclic requests (CDSS usage) for Lyme indicators (EM and DD combined). The grey line corresponds to the incidence of Lyme requests from all users and the red line corresponds to the incidence of Lyme requests made by GPs. From May 2022 onwards, the user information was available as represented by the shaded area with red double arrow. The black dashed lines and double arrow represent the full year of 2023.
Fig. 2
Fig. 2
Incidence of Antibioclic requests (CDSS usage) for Lyme indicators, in France in 2023 per 100,000 inhabitants. (a) Map of annual incidence per region. The map was generated using R version 4.4.1 (https://cran.r-project.org/) and R packages: ggplot2 (https://ggplot2.tidyverse.org/) and sf (https://r-spatial.github.io/sf/), in Rstudio version 2024.09.1 (https://posit.co/download/rstudio-desktop/). (b) Barplot of regional incidence with CI (per 100,000 inhabitants), ordered from lowest to highest incidence. Dark red bars correspond to the whole period of 2023 and light red bars correspond to the month of June 2023 (peak month). ALS = Alsace; AQU = Aquitaine; AUV = Auvergne; BNOR = Basse-Normandie; BOU = Bourgogne; BRE = Bretagne; CEN = Centre; CA = Champagne-Ardenne; COR = Corse; FC = Franche-Comté; HNOR = Haute-Normandie; IDF = Ile-de-France; LR = Languedoc-Roussillon; LIM = Limousin; LOR = Lorraine; MPY = Midi-Pyrénées; NPC = Nord-Pas-de-Calais; PDL = Pays de la Loire; PIC = Picardie; PC = Poitou–Charentes; PACA = Provence-Alpes-Côte d’Azur; RA = Rhône-Alpes.
Fig. 3
Fig. 3
Comparison of Antibioclic LB requests (AB) and the Sentinelles network Lyme incidence (SN) estimates by region in 2023. (a) Barplot showing LB incidence estimated by region from both systems, from lower to higher AB incidence. Red bars correspond to incidence of LB requests from Antibioclic indicator and green bars correspond to incidence of LB cases from the Sentinelles network. (b) Relation between AB/SN ratio and Lyme incidence from Sentinelles network in different regions. ALS = Alsace; AQU = Aquitaine; AUV = Auvergne; BNOR = Basse-Normandie; BOU = Bourgogne; BRE = Bretagne; CEN = Centre; CA = Champagne-Ardenne; COR = Corse; FC = Franche-Comté; HNOR = Haute-Normandie; IDF = Ile-de-France; LR = Languedoc-Roussillon; LIM = Limousin; LOR = Lorraine; MPY = Midi-Pyrénées; NPC = Nord-Pas-de-Calais; PDL = Pays de la Loire; PIC = Picardie; PC = Poitou–Charentes; PACA = Provence-Alpes-Côte d’Azur; RA = Rhône-Alpes.
Fig. 4
Fig. 4
Comparison of annual incidences between Antibioclic LB requests (red line) and the Sentinelles network LB incidence (green line) from 2018 to 2023, per 100,000 inhabitants.
Fig. 5
Fig. 5
Comparison of incidence between Antibioclic LB requests and survey results, June 2024. (a) Map of regional incidence of Lyme Antibioclic requests submitted to CDSS (per 100,000 inhabitants) in France. The map was generated using R version 4.4.1 (https://cran.r-project.org/) and R packages: ggplot2 (https://ggplot2.tidyverse.org/) and sf (https://r-spatial.github.io/sf/), in Rstudio version 2024.09.1 (https://posit.co/download/rstudio-desktop/). (b) Map of the regional incidence of Lyme suspect cases seen in consultations (per 100,000 inhabitants) in France, from the survey. The map was generated using R version 4.4.1 (https://cran.r-project.org/) and R packages: ggplot2 (https://ggplot2.tidyverse.org/) and sf (https://r-spatial.github.io/sf/), in Rstudio version 2024.09.1 (https://posit.co/download/rstudio-desktop/). (c) Barplot of regional incidence with CI95% (per 100,000 inhabitants): dark blue bars correspond to incidence of Lyme suspect cases seen in consultations, light blue bars correspond to incidence of Lyme suspect cases where GPs consulted Antibioclic during consultation, and red bars correspond to the incidence of Lyme Antibioclic requests. (d) Scatter plot of the relation between the incidence of Lyme suspect cases and Lyme Antibioclic requests.

Similar articles

References

    1. Rizzoli, A. et al. Lyme borreliosis in Europe. Eurosurveillance16, 19906 (2011). - PubMed
    1. Chomel, B. Lyme disease. Rev. Sci. Tech. Off. Int. Epiz.34, 569 (2015). - PubMed
    1. Stanek, G., Wormser, G. P., Gray, J. & Strle, F. Lyme borreliosis. The Lancet379, 461–473 (2012). - PubMed
    1. Aguero-Rosenfeld, M. E., Wang, G., Schwartz, I. & Wormser, G. P. Diagnosis of Lyme Borreliosis. Clin. Microbiol. Rev.18, 484 (2005). - PMC - PubMed
    1. Septfons, A. et al. Seroprevalence for Borrelia burgdorferi sensu lato and tick-borne encephalitis virus antibodies and associated risk factors among forestry workers in northern France, 2019 to 2020. Eurosurveillance28(32), 9–20. 10.2807/1560-7917.ES.2023.28.32.2200961 (2023). - PMC - PubMed

LinkOut - more resources