. 2025 May 3;31(1):166.
doi: 10.1186/s10020-025-01231-4.

Calpain1 inhibition enhances autophagy-lysosomal pathway and ameliorates tubulointerstitial fibrosis in Nephronophthisis

Affiliations

Calpain1 inhibition enhances autophagy-lysosomal pathway and ameliorates tubulointerstitial fibrosis in Nephronophthisis

Dantong Li et al. Mol Med. .

Abstract

Background: Nephronophthisis (NPH) is classified under the category of renal ciliopathies and is the most common genetic disease leading to renal failure in children. Early-onset and progressive renal tubulointerstitial fibrosis represents one of the most significant features, culminating in renal insufficiency. However, the molecular mechanism of tubulointerstitial fibrosis remains unclear. Previously, we constructed an NPH mouse model via CRISPR-Cas9. This mouse model demonstrated typical features of tubulointerstitial fibrosis. In this study, we aimed to explore the pathogenesis of tubulointerstitial fibrosis in NPH and identify early intervention targets in both the NPH models and patients.

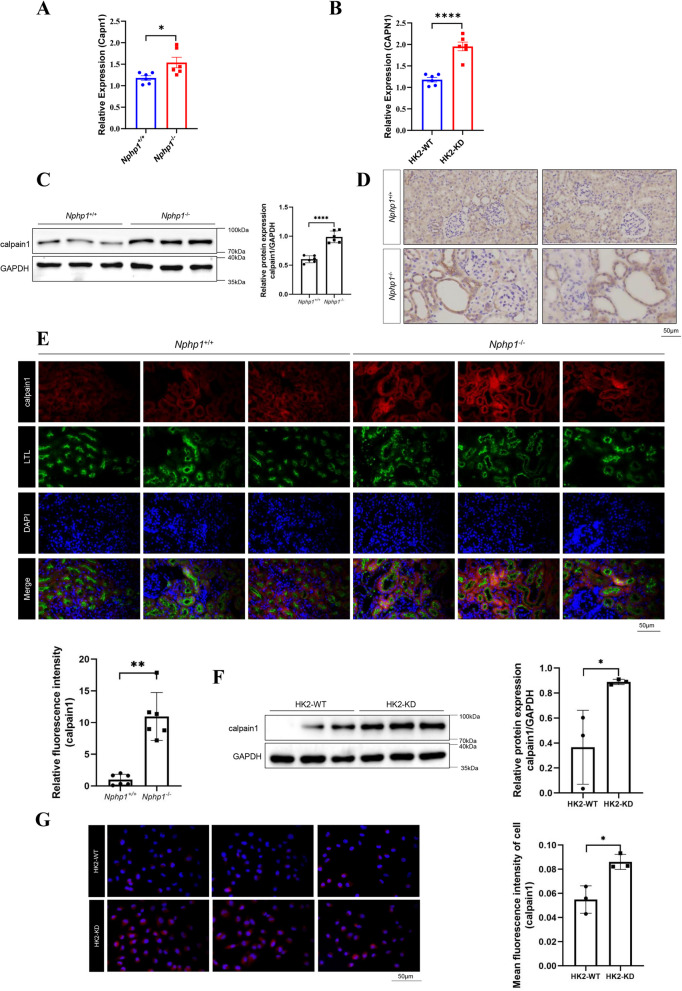
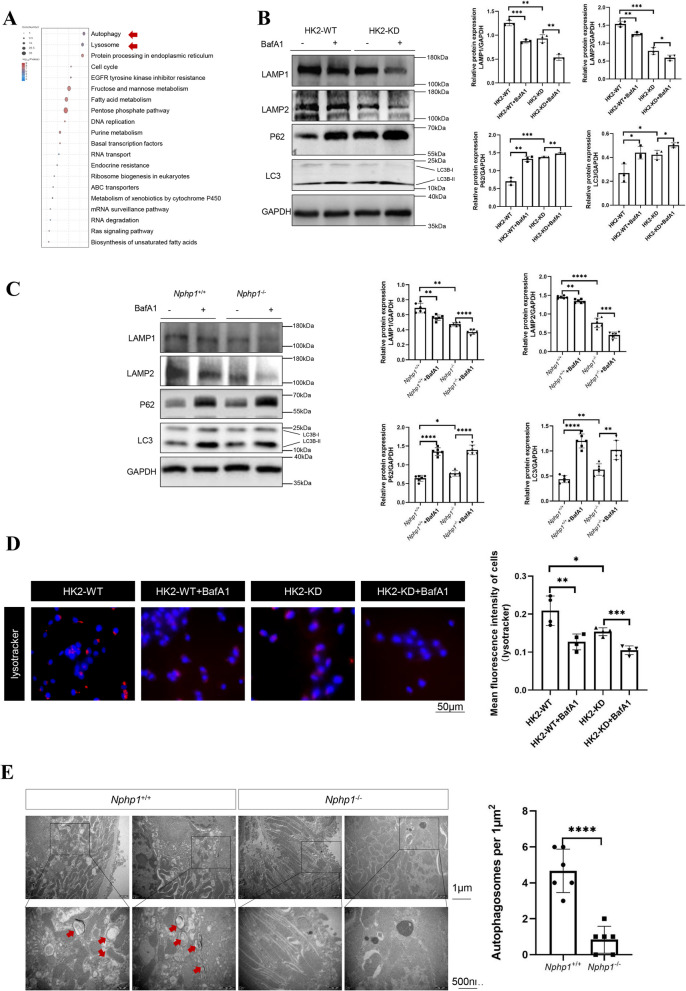
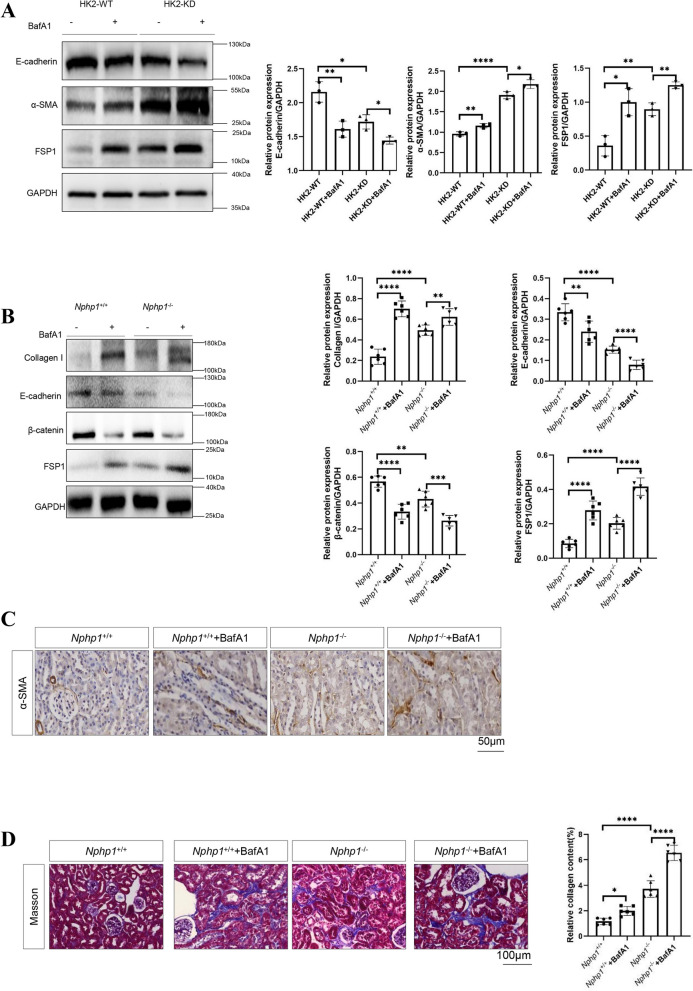
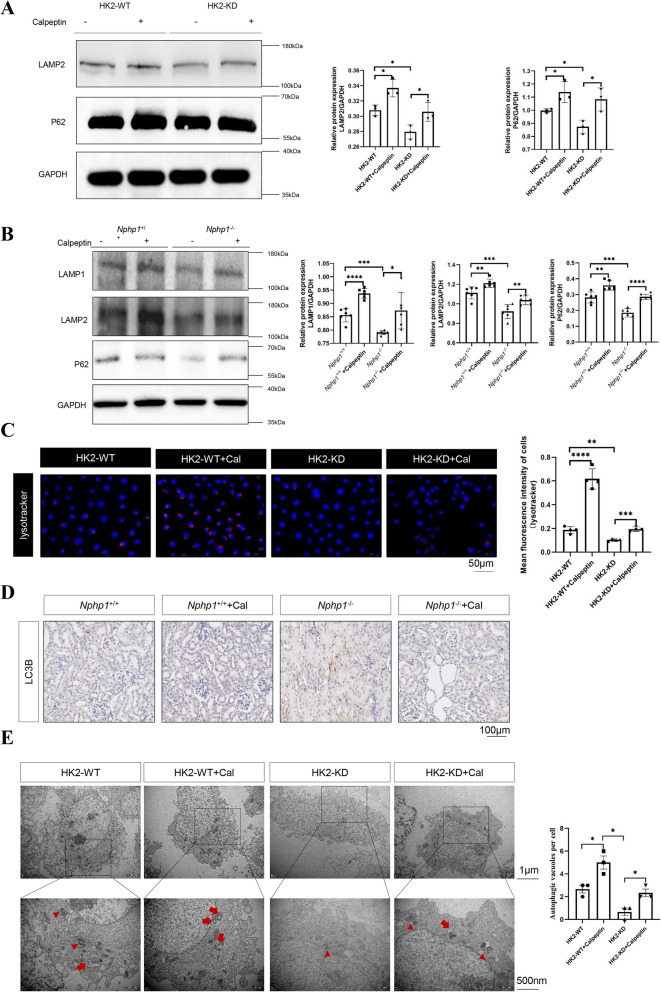
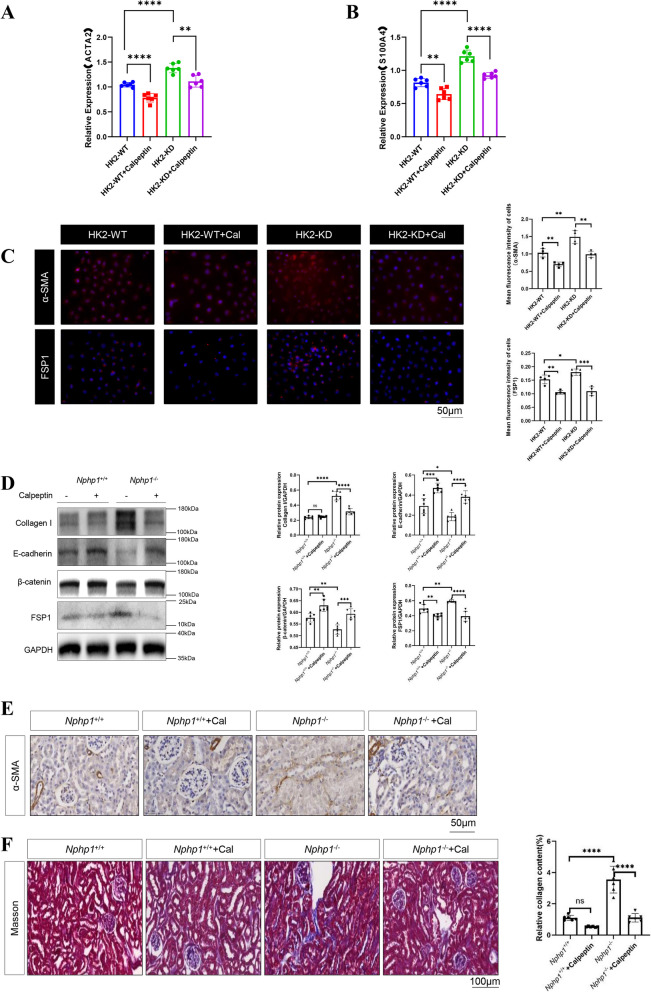
Methods: In this study, transcriptome changes in mouse kidneys were analyzed through RNA sequencing to explore the molecular mechanisms of renal tubulointerstitial fibrosis in NPH. We found an increased abundance of calpain1 in both the NPH models and patients. Pathway enrichment analysis indicated autophagy-lysosomal pathway was altered in the NPH models. Western blot, immunofluorescence or immunohistochemical staining were used to verify the expression of calpain1. We also detected autophagy activities in NPH models by lysotracker staining and transmission electron microscopy (TEM). Epithelial or mesenchymal-specific markers and Masson's trichrome staining were used to detect the status of tubulointerstitial fibrosis. Furthermore, NPH models were treated with a calpain1 inhibitor to explore the role of calpain1 in autophagy-lysosomal pathway and tubulointerstitial fibrosis.

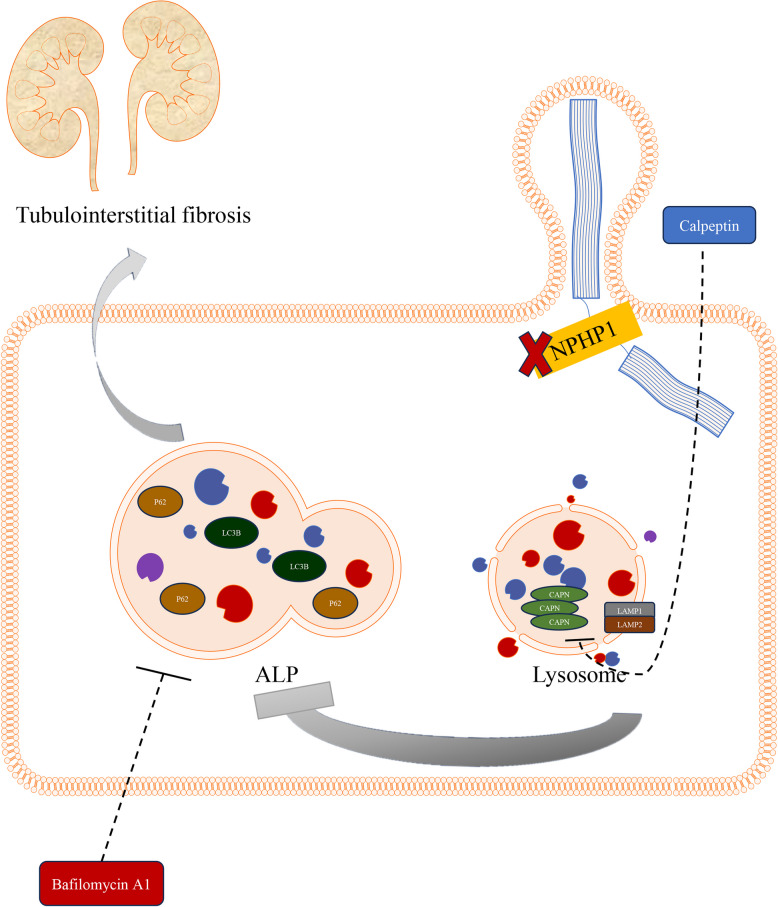
Results: The increased abundance of calpain1 impaired the autophagy-lysosomal pathway and induced tubulointerstitial fibrosis by promoting epithelial-to-mesenchymal transition. On the other hand, calpain1 inhibition could enhance the autophagy-lysosomal pathway and ameliorate the phenotypes of tubulointerstitial fibrosis in NPH models.

Conclusions: Calpain1-mediated autophagy-lysosomal pathway disorder may be an important cause of tubulointerstitial fibrosis in NPH. Calpain1 may have therapeutic implications for renal tubulointerstitial fibrosis.

Keywords: Calpain1; Inherited kidney disease; Nephronophthisis; Renal ciliopathies; Renal tubulointerstitial fibrosis.


Conflict of interest statement

Declarations. Ethics approval and consent to participate: Research involving human data was performed in accordance with the Declaration of Helsinki of 1975, as revised in 1983. All recruited subjects agreed to participate in the experiment and signed the consent form. Research involving human data was approved by Guangdong Provincial People's Hospital (Ethics Approval Number: S2023-010–01). All animals were maintained according to the ARRIVE1 guidelines, and all protocols for animal use and euthanasia were reviewed and approved by the Institutional Animal Care and Use Committee of Nanfang Hospital, Southern Medical University (Ethics Approval Number: IACUC-LAC-20220723–001). Consent for publication: Consent for publication was obtained from the patients mentioned in this study. Copies of consent forms could be sent upon request. Competing interests: The authors declare no competing interests.

Figures

Fig. 1
Fig. 1
The upregulation of calpains in NPH. A Volcano plot of differentially expressed genes (DEGs) in the kidneys of wild-type and Nphp1 knockout mice (n = 3). B Heatmap of the top 20 DEGs in wild-type and Nphp1 knockout mouse kidneys (n = 3). C RT-qPCR analysis on expression of Capn11 in in the kidneys of wild-type and Nphp1 knockout mice (n = 6). β-actin was used as an internal control. D RNA-seq was performed on tissue samples from 95 human individuals representing 27 different tissues to determine tissue-specificity of CAPN11. RPKM, reads per kilobase per million reads placed. a1, adrenal; a2, appendix; b1, bone marrow; b2, brain; c1, colon; d1, duodenum; e1, endometrium; e2, esophagus; f1, fat; g1, gall bladder; h1, heart; k1, kidney; l1, liver; l2, lung; l3, lymph node; o1, ovary; p1, pancreas; p2, placenta; p3, prostate; s1, salivary gland; s2, skin; s3, small intestine; s4, spleen; s5, stomach; t1, testis; t2, thyroid; and u1, urinary bladder. The red arrow represents the expression of calpain11 in the kidney. E Multiple sequence alignment (MSA) results for human calpain11 and human calpain1. The black and green arrows represent the amino acid sequences of human calpain11 and human calpain1, respectively. F Western blot was used to detect the expression of calpain1 in urine-derived epithelial cells isolated from NPH patients or healthy controls. Samples in the first and second lanes were extracted from urine on two different days but from the same person. Samples in the third and fourth lanes were extracted from urine on two different days but from the same NPH patient. HC, healthy controls; NPH, NPH patients. G Immunofluorescence staining of calpain1 (red) and Lotus tetragonolobus lectin (LTL, green) in kidney sections from a patient diagnosed with nephrotic syndrome (NS) and an NPH patient indicating the distribution of calpain1 in proximal tubular epithelial cells. Scale bar = 100 μm
Fig. 2
Fig. 2
The upregulation of calpain1 in NPH model. A RT-qPCR analysis on expression of Capn1 in in the kidneys of wild-type and Nphp1 knockout mice (n = 6). β-actin was used as an internal control. B RT-qPCR analysis on expression of CAPN1 in in the kidneys of wild-type and NPHP1 knockdown HK2 cells (n = 6). β-actin was used as an internal control. C Calpain1 expression in the kidneys of wild-type and Nphp1 knockout mice was detected via western blot. The result of the quantitative analysis was displayed as bar graphs. n = 6 in each group. D Calpain1 expression in the kidneys of wild-type and Nphp1 knockout mice was detected via immunohistochemical staining. Scale bar = 50 μm. E Immunofluorescence staining of calpain1 (red) and LTL (green) in the kidneys of wild-type and Nphp1 knockout mice revealed the distribution of calpain1 in proximal tubular epithelial cells. Scale bar = 50 μm. The results of the quantitative analysis of calpain1 staining in mouse kidneys were evaluated. n = 6 in each group. F Calpain1 expression in wild-type and NPHP1 knockdown HK2 cells was detected by western blot. The result of the quantitative analysis was displayed as bar graphs. n = 3 in each group. G Calpain1 was detected by immunofluorescence in wild-type and NPHP1 knockdown HK2 cells. The results of the quantitative analysis of calpain1 staining in HK2 cells was evaluated. n = 3 in each group, Scale bar = 50 μm. * P < 0.05; ** P < 0.01; *** P < 0.001; **** P < 0.0001
Fig. 3
Fig. 3
An impaired autophagy-lysosomal pathway was detected in the NPH models. A The top 20 enriched pathways in wild-type and Nphp1 knockout mouse kidneys (n = 3). B Representative western blot analysis showing the expression of autophagic biomarkers and lysosomal biomarkers in wild-type and NPHP1 knockdown HK2 cells. The result of the quantitative analysis was displayed as bar graphs. n = 3 in each group. C Representative western blot analysis showing the expression of autophagic biomarkers and lysosomal biomarkers in the kidneys of wild-type and Nphp1 knockout mice. The result of the quantitative analysis was displayed as bar graphs. n = 6 in each group. D Wild-type and NPHP1 knockdown HK2 cells were stained with LysoTracker™ Deep Red (red) and DAPI (blue). The results of the quantification of lysotracker staining in HK2 cells were evaluated. n = 4 in each group. Scale bar = 50 μm. E Transmission electron microscopy (TEM) analysis showing autophagosomes (arrow) in the kidneys of wild-type and Nphp1 knockout mice. Scale bar = 1.0 µm (upper panel) or 500 nm (lower panel). The number of autophagosomes in mouse kidneys was quantified. n = 6 in each group. * P < 0.05; ** P < 0.01; *** P < 0.001; **** P < 0.0001
Fig. 4
Fig. 4
An impaired autophagy-lysosomal pathway in NPH models induces tubulointerstitial fibrosis. A Western blot analysis of the expression of epithelial and mesenchymal markers in wild-type and NPHP1 knockdown HK2 cells. The result of the quantitative analysis was displayed as bar graphs. n = 3 in each group. B Western blot analysis of the expression of epithelial and mesenchymal markers in wild-type and Nphp1 knockout mouse kidneys. The presence of two Collagen I bands (130–140 kDa) in the fourth lane can be attributed to the presence of multiple post-translational isoforms (e.g., glycosylated or acylated adducts) or different building units being synthesized (e.g., α1 or α2 chain) that were not resolved by electrophoresis. The result of the quantitative analysis was displayed as bar graphs. n = 6 in each group. C The expression of α-SMA in renal sections extracted from wild-type and Nphp1 knockout mice was detected via immunohistochemical staining. Scale bar = 50 μm. D Masson’s trichrome (Masson) staining of renal sections was used to assess tubulointerstitial fibrosis in wild-type and Nphp1 knockout mouse kidneys. Scale bar = 100 μm. The result of the quantitative analysis was displayed as bar graphs. n = 6 in each group. * P < 0.05; ** P < 0.01; *** P < 0.001; **** P < 0.0001
Fig. 5
Fig. 5
Calpain1 inhibition improves the autophagy-lysosomal pathway in NPH models. A HK2 cells were treated with or without calpeptin. Western blot was used to detect the expression of autophagic biomarkers and lysosomal biomarkers. The result of the quantitative analysis was displayed as bar graphs. n = 3 in each group. B Wild-type and Nphp1 knockout mice were treated with or without calpeptin. Western blot was used to detect the expression of autophagic biomarkers and lysosomal biomarkers. The result of the quantitative analysis was displayed as bar graphs. n = 6 in each group. C LysoTracker™ Deep Red was used to label and track lysosomes in HK2 cells with or without calpeptin treatment. Quantitative analysis of lysosome signals in HK2 cells was performed. n = 4 in each group. Scale bar = 50 μm. D Immunohistochemical staining was used to detect the expression of LC3B in mouse kidneys with or without calpeptin treatment. Scale bar = 100 μm. E TEM analysis showing autophagosomes (red arrows) and autolysosomes (red triangles) in the wild-type and NPHP1 knockdown HK2 cells with or without calpeptin treatment. Scale bar = 1.0 µm (upper panel) or 500 nm (lower panel). The number of autophagosomes and autolysosomes in HK2 cells was quantified. n = 3 in each group. * P < 0.05; ** P < 0.01; *** P < 0.001; **** P < 0.0001
Fig. 6
Fig. 6
Calpain1 inhibition improves tubulointerstitial fibrosis in NPH models. A RT-qPCR analysis on expression of α-SMA in HK2 cells treated with or without calpeptin. β-actin was used as an internal control. n = 6 in each group. B RT-qPCR analysis on expression of FSP1 in HK2 cells treated with or without calpeptin. β-actin was used as an internal control. n = 6 in each group. C The expression of α-SMA and FSP1 in HK2 cells were detected by immunofluorescence. Scale bar = 50 μm. Quantitative analysis for α-SMA and FSP1 staining in HK2 cells with or without calpeptin treatment was evaluated. n = 4 in each group. D The expression of several epithelial and mesenchymal markers in mouse kidneys with or without calpeptin treatment was measured by western blot. The result of the quantitative analysis was displayed as bar graphs. n = 6 in each group. E The expression of α-SMA in renal sections was observed by immunohistochemistry. n = 6 in each group. Scale bar = 50 μm. F Masson staining of renal sections was used to assess the tubulointerstitial fibrosis. Scale bar = 100 μm. The result of the quantitative analysis was displayed as bar graphs. n = 6 in each group. * P < 0.05; ** P < 0.01; *** P < 0.001; **** P < 0.0001
Fig. 7
Fig. 7
Graphical abstract. In the context of NPH (NPHP1-deficiency), upregulation of calpain1(CAPN) and impairment of autophagy-lysosomal pathway were detected. The impaired autophagy-lysosomal pathway might be caused by the upregulation of calpain1 and could induce tubulointerstitial fibrosis. When calpain1 was inhibited by calpeptin, the autophagy-lysosomal pathway was enhanced. Furthermore, calpain1 inhibition resulted in antifibrotic effects in NPH. ALP, autophagy-lysosomal pathway

Similar articles

References

    1. Arnandis T, Ferrer-Vicens I, García-Trevijano ER, et al. Calpains mediate epithelial-cell death during mammary gland involution: mitochondria and lysosomal destabilization. Cell Death Differ. 2012;19(9):1536–48. 10.1038/cdd.2012.46. - PMC - PubMed
    1. Arrington DD, Van Vleet TR, Schnellmann RG. Calpain 10: a mitochondrial calpain and its role in calcium-induced mitochondrial dysfunction. Am J Physiol Cell Physiol. 2006;291(6):C1159–71. - PubMed
    1. Azam M, Andrabi SS, Sahr KE, Kamath L, Kuliopulos A, Chishti AH. Disruption of the mouse mu-calpain gene reveals an essential role in platelet function. Mol Cell Biol. 2001;21(6):2213–20. 10.1128/MCB.21.6.2213-2220.2001. - PMC - PubMed
    1. Bonora M, Patergnani S, Ramaccini D, et al. Physiopathology of the permeability transition pore: molecular mechanisms in human pathology. Biomolecules. 2020;10(7):998. 10.3390/biom10070998. - PMC - PubMed
    1. Braun DA, Hildebrandt F. Ciliopathies. Cold Spring Harb Perspect Biol. 2017;9(3):a028191. 10.1101/cshperspect.a028191. - PMC - PubMed

LinkOut - more resources