. 2025 May 3;20(1):51.
doi: 10.1186/s13024-025-00840-1.

Alzheimer's disease protective allele of Clusterin modulates neuronal excitability through lipid-droplet-mediated neuron-glia communication

Affiliations

Alzheimer's disease protective allele of Clusterin modulates neuronal excitability through lipid-droplet-mediated neuron-glia communication

Xiaojie Zhao et al. Mol Neurodegener. .

Abstract

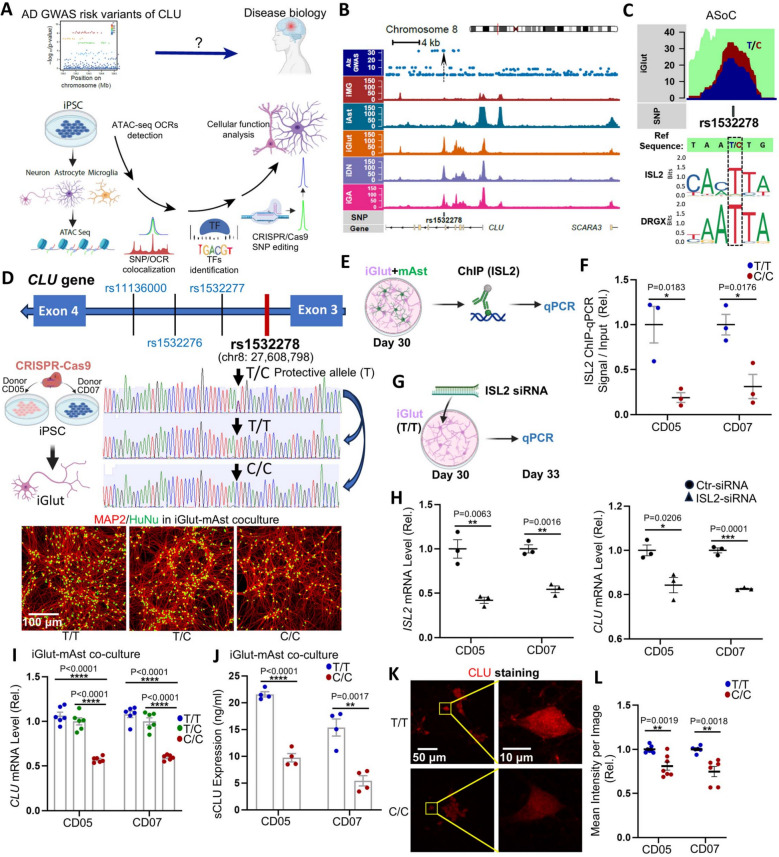
Background: Genome-wide association studies (GWAS) of Alzheimer's disease (AD) have identified a plethora of risk loci. However, the disease variants/genes and the underlying mechanisms have not been extensively studied.

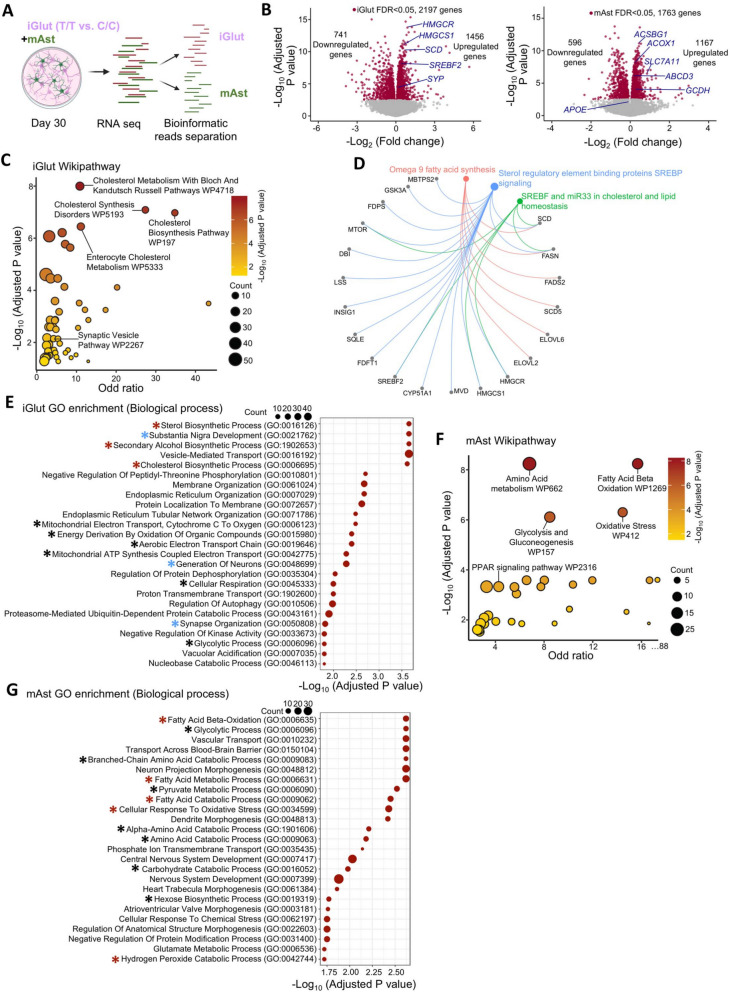
Methods: Bulk ATAC-seq was performed in induced pluripotent stem cells (iPSCs) differentiated various brain cell types to identify allele-specific open chromatin (ASoC) SNPs. CRISPR-Cas9 editing generated isogenic pairs, which were then differentiated into glutamatergic neurons (iGlut). Transcriptomic analysis and functional studies of iGlut co-cultured with mouse astrocytes assessed neuronal excitability and lipid droplet formation.

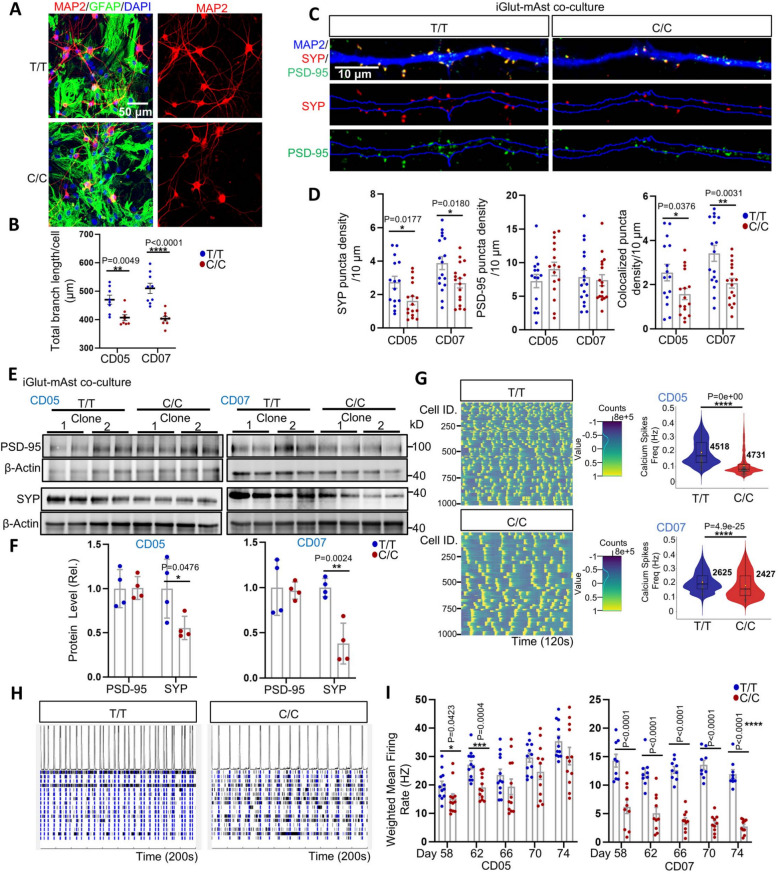
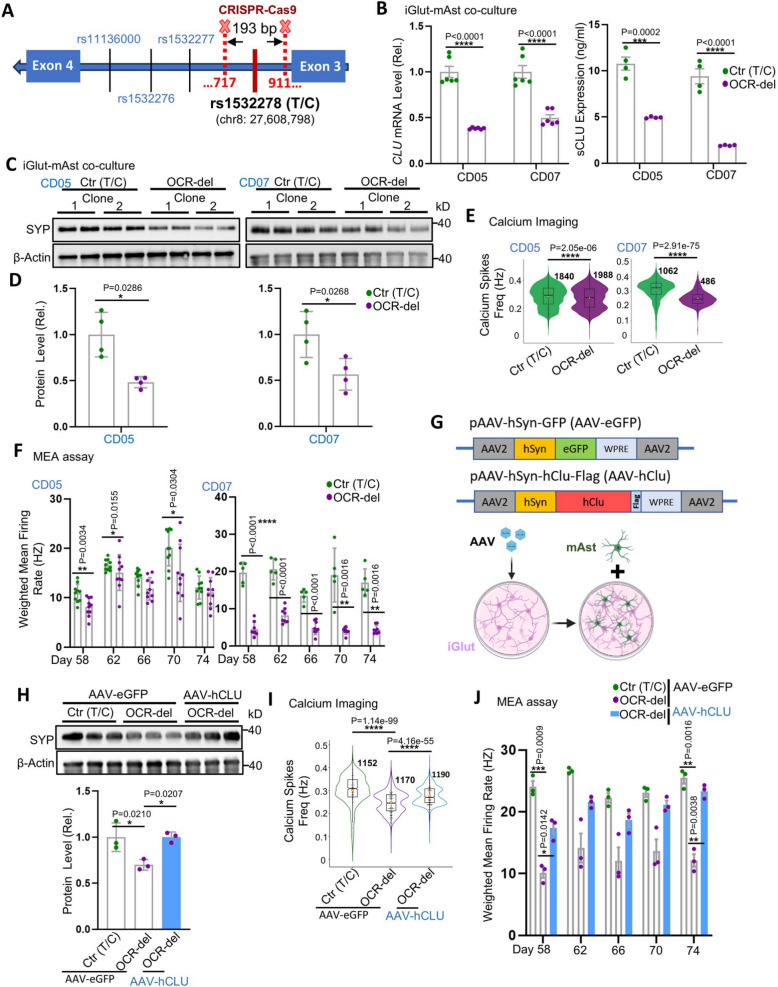
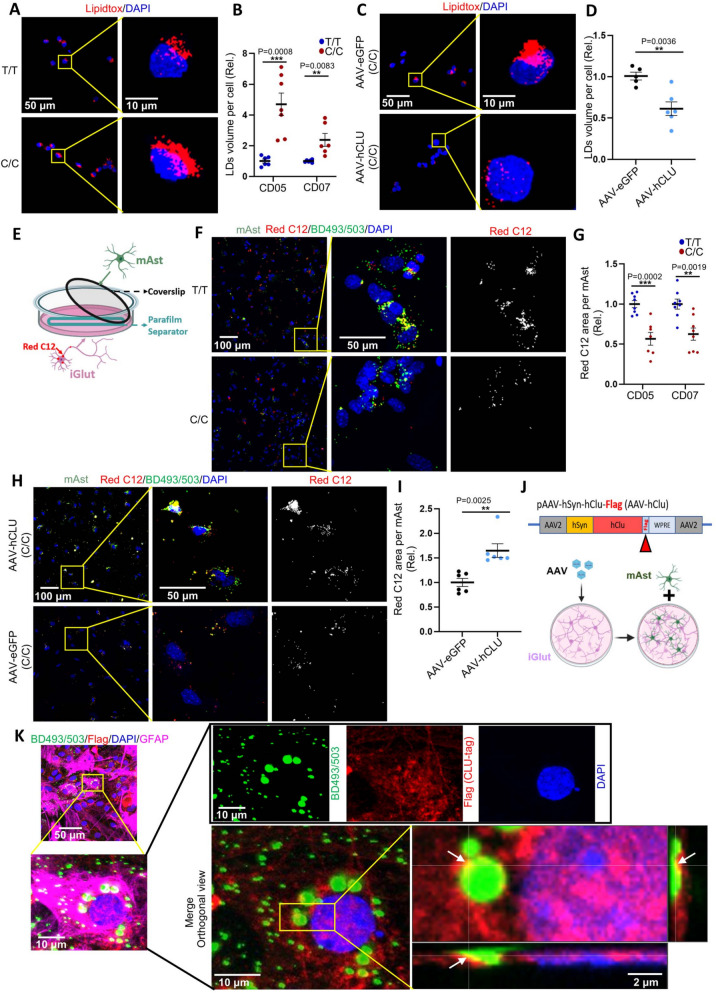
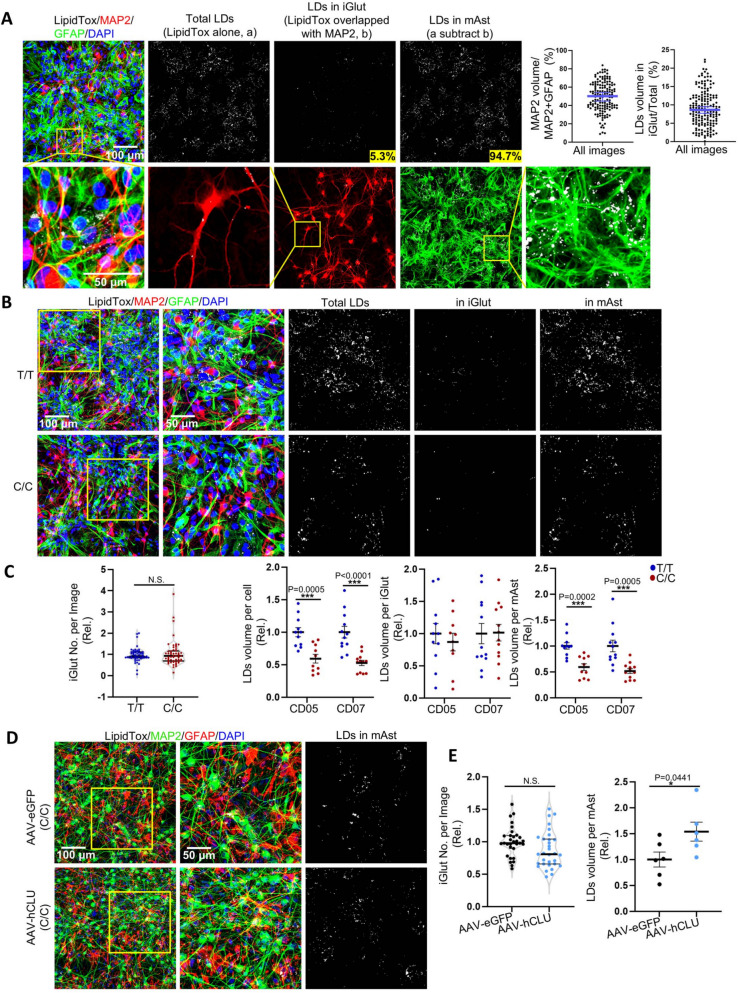
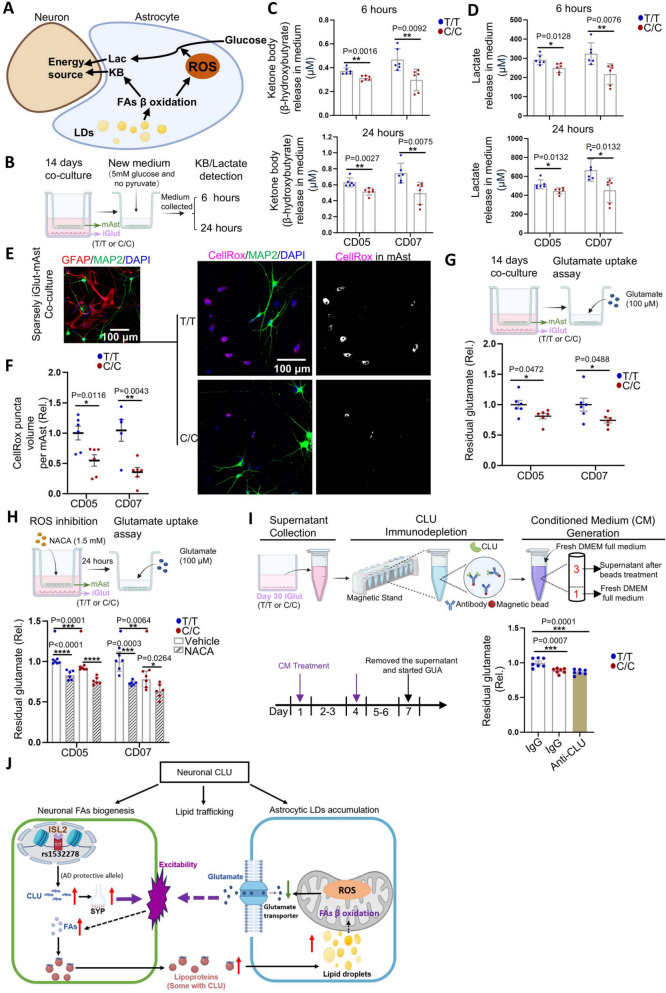
Results: We identified a putative causal SNP of CLU that impacted neuronal chromatin accessibility to transcription-factor(s), with the AD protective allele upregulating neuronal CLU and promoting neuron excitability. And, neuronal CLU facilitated neuron-to-glia lipid transfer and astrocytic lipid droplet formation coupled with reactive oxygen species (ROS) accumulation. These changes caused astrocytes to uptake less glutamate thereby altering neuron excitability.

Conclusions: For a strong AD-associated locus near Clusterin (CLU), we connected an AD protective allele to a role of neuronal CLU in promoting neuron excitability through lipid-mediated neuron-glia communication. Our study provides insights into how CLU confers resilience to AD through neuron-glia interactions.

Keywords: Allele-specific open chromatin; Alzheimer’s disease; Clusterin; Genome-wide association study; IPSC; Lipid droplets; Neuron excitability; Neuron-glia lipid transfer; Protective allele.


Conflict of interest statement

Declarations. Ethics approval and consent to participate: Any data derived from human cells and tissue, and mouse experiments were approved by Endeavor Health (formerly NorthShore University HealthSystem) institutional review board (IRB). Consent for publication: Not applicable. Competing interests: The authors declare no competing interests.

Figures

Fig. 1
Fig. 1
AD risk SNP rs1532278 shows allele-specific open chromatin (ASoC) and cis-regulates CLU expression in iGlut. A Schematic research design. ATAC-seq was performed to identify OCRs and GWAS risk SNPs that showed ASoC in iPSC Glutaminergic (iGlut), GABAergic (iGABA), and dopaminergic (iDA) neurons, and microglia (iMG) and astrocytes (iAst), which is followed by transcription factor (TF) binding prediction to confirm putative functional AD risk SNP, CRIPSR-cas9 SNP editing, and functional assays in cells. B ASoC mapping identifies intronic rs1532278 as a putatively functional SNP among several other GWAS risk SNPs equivalently associated with AD at the CLU locus. Note that rs1532278 is the only SNP within the neuronal OCR with a stronger OCR peak in iGlut. C T and C alleles of rs1532278 show differential allelic ATAC-seq reads (i.e., ASoC) in iGlut. The bottom panel shows the two most conserved TF binding motifs at the SNP site. D Schematic CLU gene structure near rs1532278 (upper panel) and a diagram showing CRISPR-Cas9 editing of rs1532278 in two iPSC lines (CD05 and CD07; T/C) to covert T/C lines to isogenic T/T and C/C lines (middle panel, representative Sanger sequencing result from CD07 line). Representative images of iGlut (CD07 line) of all three genotypes are also shown (bottom panel); MAP2 and HuNu (human nuclear antigen) staining shows the morphology of iGlut and neuron purity in iGlut-mAst co-cultures. EF ISL2 ChIP-qPCR on day 30 iGlut-mAst co-cultures. n = 3 biological replicates from one clone per line of one independent differentiation. G-H ISL2 siRNA knockdown in day- 30 pure iGlut (T/T) cultures. Samples of 72 h post-siRNA transfection were used for qPCR. n = 3 biological replicates from one clone per line of one independent differentiation. I Neuronal CLU mRNA level in isogenic iGlut-mAst co-cultures of different genotype of rs1532278 (human-specific CLU qPCR assay was used). n = 6 biological replicates per group (2–3 clones per line and 2–3 biological replicates for each clone) from two independent differentiations of each line. J Secreted CLU (sCLU) detected by ELISA from the supernatant of iGlut-mAst co-cultures. n = 4 biological replicates per group (2 clones per line and 2 biological replicates per clone) from two independent differentiations of each line. K-L Immunofluorescence staining of CLU in day 25 pure iGlut cultures. n = 6–7 coverslips per group (In total: 2 clones per line and 3–4 coverslips for each clone and 3–5 images per coverslip; shown are example images of CD05) from two independent differentiations of each line. Data, mean ± SEM. * p < 0.05, ** p < 0.01, *** p < 0.001, and **** p < 0.0001. Scale bars are indicated in each image
Fig. 2
Fig. 2
iGlut carrying the AD protective allele of rs1532278 at the CLU locus are more morphologically complex and functionally active. A MAP2 staining for analyzing iGlut dendritic branches in day- 30 iGlut-mAst co-cultures. B Quantification of total branch length per cell (by Cellprofiler). n = 8–9 coverslips per group (2 clones per line, 4–5 coverslips per clone, and 3–5 images per coverslip) from two independent differentiations of each line. C MAP2, SYP, and PSD- 95 staining for assaying synaptic puncta. D Quantification of SYP and PSD- 95 puncta density per 10 µm. n = 15–17 neurons per group (1–2 neuron per coverslips, 5–6 coverslips per clone, and 2 clones per line) from two independent differentiations of each line. EF Western blotting for measuring PSD- 95 and SYP levels in day- 30 iGlut-mAst co-cultures. n = 4 biological replicates per group (2 clones per line and 2 biological replicates per clone) from two independent differentiations of each line. G Calcium imaging shows high firing frequency with T/T iGlut in co-cultures. Left panel, heatmaps of neuron firing peaks in calcium imaging assay during 120 s of recording (representative image from 1,000 cells of CD05); Right panels, quantification of neuron firing frequency. The number of neurons assayed is shown in the violin plot (2–3 clones per line with 6 biological replicates per clone from two independent differentiations of each line). H Representative roster blot of MEA from the CD07 line (a segment of 200 s is shown). I Weighted mean firing rate in MEA. n = 9–12 biological replicates per group (2–3 clones per line and 3–4 biological replicates per clone) from two independent differentiations of each line. Violin plots are shown with data median and interquartile range or box and whisker, all other statistical graphs depict mean ± SEM. Scale bars are indicated in the corresponding images. * p < 0.05, ** p < 0.01, *** p < 0.001, and **** p < 0.0001
Fig. 3
Fig. 3
Neuronal CLU mediates the AD protective allele effect of rs1532278 on neuron excitability. A Schematic diagram of the rs1532278-flanking OCR deletion by CRISPR-Cas9. B CLU mRNA level (n = 6 biological replicates per group, 2 clones per line, and 3 biological replicates for each clone from two independent differentiations of each line) and sCLU level (n = 4 biological replicates per group, 2 clones per line, and 2 biological replicates for each clone from two independent differentiations of each line) in day- 30 iGlut-mAst co-culture. C-D Western blotting detected SYP levels in day- 30 iGlut-mAst co-cultures. n = 4 biological replicates per group (2 clones per line and 2 biological replicates for each clone) from two independent differentiations of each line. E Fire frequency analysis of calcium imaging assay. The indicated number of neurons is from 2 clones of each line and 3 biological replicates per clone from two independent differentiations of each line. F Weighted mean firing rate analysis in MEA. n = 5–10 biological replicates per group (2–5 biological replicates per clone and 2 clones per line) from two independent differentiations of each line. G The schematic diagram illustrates CLU overexpression in iGlut. AAV-hCLU, hCLU-Flag cDNA was inserted into the vector to replace the eGFP sequence in AAV-eGFP. AAV Virus infected neurons on day 8, followed by replating neurons with mAst on day 12. For the calcium imaging assay, the jRCaMP1b virus was introduced on day 9. H Western blotting for SYP in day- 30 iGlut-mAst co-cultures. n = 3 biological replicates per group (all from one clone of the CD07 line) from one independent differentiation. I Calcium transmission frequency. The number of neurons from 5 biological replicates in each group from one clone of line CD07 from two independent differentiations. J Weighted mean firing rate in MEA. n = 3 biological replicates per group from one clone of line CD07 in from one independent differentiation. Violin plots are shown with box and whisker; all other graphs depict mean ± SEM. Scale bars are indicated in the corresponding images. * p < 0.05, ** p < 0.01, *** p < 0.001, and **** p < 0.0001
Fig. 4
Fig. 4
Transcriptomic analysis of iGlut-mAst co-cultures highlights the involvement of lipid metabolism. A Schematic diagram for RNA-seq data processing pipeline to separate sequencing reads of human and mouse origins. (n = 9 biological replicates per group from two independent differentiations of each line, 2–3 biological replicates per clone, 2 clones per line, and 2 lines in total). B Volcano plots show DE genes in iGlut (left) and the co-cultured mAst (right) with highlighted genes. Log2FC was based on a comparison of T/T vs. C/C cultures. C Wiki pathway analysis of upregulated gene sets in iGlut. D The Cnet plot depicts the enriched fatty-acid biosynthesis pathways and the upregulated genes. E GO-term (biological process) enrichment in significantly upregulated gene sets in iGlut. Red star, lipid biosynthesis pathways; black star, energy metabolism pathways; blue star, neuron-morphology related pathway. F Wiki pathway analysis of the significantly upregulated gene sets in mAst. G GO-term (biological process) enrichment in significantly upregulated gene sets in mAst. Red star, fatty acids metabolism-related pathways; black star, metabolism-related pathways
Fig. 5
Fig. 5
Neuronal CLU facilitates neuron-to-astrocyte lipid transfer. A-B Lipid droplet (LD) staining by LipidTox in day 25 iGlut pure cultures (T/T vs. C/C). n = 6–7 coverslips per group (2 clones per line, 3–4 coverslips for each clone with 4–5 images per coverslip) from two independent differentiations of each line. Representative images in (A) from CD07 line. C-D LipidTox staining of Day 25 iGlut pure cultures after AAV-CLU overexpression. n = 5–6 coverslips per group (one clone from CD05 with genotype C/C, and 4–5 images of each coverslip) from two independent differentiations. Representative images in (C) from CD07 line. E The schematic diagram for the Red C12 lipid transfer assay. F-G Red C12 and LDs (BD493/503) signals in mAst. n = 7–8 coverslips per group (mAst co-cultured with 2 clones per line, 3–5 coverslips for each clone with 4–6 images from each coverslip) from two independent differentiations of each line. Representative images in (F) from CD05 line. H-I A Red C12 transfer assay was performed in the CLU overexpression system. iGlut were first infected with either AAV-eGFP or AAV-hCLU, as in (C). Red C12 was applied to the iGlut on Day 30, and its transfer to mAst was analyzed using the same procedures outlined in (E). n = 6 coverslips per group (mAst co-cultured with one clone of CD05 C/C line, and 6 coverslips for per group with 4–5 images from each coverslip) from two independent differentiations. J The schematic diagram for overexpression of CLU tagged with Flag. K Co-localization of neuron secreted and AAV-derived CLU (Flag +) and LDs (BD493/503 +) in mAst from day- 30 iGlut-mAst cocultures after AAV-hCLU infection (same experimental approach as Fig. 3G). Representative images from CD07 line. All statistical graphs depict mean ± SEM. Scale bars are indicated in corresponding image. * p < 0.05, ** p < 0.01, *** p < 0.001, and **** p < 0.0001
Fig. 6
Fig. 6
The AD protective allele of rs1532278 at the CLU locus in iGlut induces LD accumulation in co-cultured mAst. A LD staining in iGlut-mAst co-cultures by LipidTox (Example images of C/C CD07 co-cultures). LDs were categorized by neuronal (MAP2 +) or astrocytic (i.e., not neuronal) and quantification was shown in the right panels. Neuronal LDs, LDs in iGlut relative to total LD volume. The proportion of the image area occupied by iGlut was calculated as MAP2 volume divided by the total of GFAP and MAP2 volume. n = 173 images from LipidTox staining in all iGlut-mAst co-cultures (Fig. 6B and C, Fig. S8 C and S8D). B-C LDs staining and quantification by LipidTox in day- 30 iGlut-mAst co-cultures. n = 10–12 coverslips per group (2 clones per line, 4–6 coverslips for each clone with 3–5 images per coverslip, and shown are example images of CD07) from 2–3 independent differentiations of each line. D-E LDs level (LipidTox staining) in mAst in day- 30 iGlut-mAst co-culture after CLU overexpression. LDs, LipidTox +; neurons, MAP2 +; astrocytes, GFAP +. n = 6 coverslips per group (one clone of CD05 C/C line, and 6 coverslips per group with 5–6 images from each coverslip) from two independent differentiations. Violin plots are shown with data median and interquartile range. Other data, mean ± SEM. Scale bars are indicated in corresponding image. * p < 0.05, ** p < 0.01, *** p < 0.001, and **** p < 0.0001
Fig. 7
Fig. 7
Astrocytes co-cultured with iGlut carrying the AD protective allele show increased energy production and ROS level and reduced glutamate uptake. A The schematic diagram depicts the FA β oxidation process of astrocytes, where they produce KB (ketone body) and ROS; the glycolysis is further facilitated by ROS and generates Lac (lactate); both KB and Lac are further transferred to surrounding neurons as the energy source. B the schematic diagram depicts the transwell co-culture system to measure KB and Lac release from mAst. C-D The amount of ketone body (β-hydroxybutyrate) and Lactate released from mAst at different time points in the transwell co-culture system. n = 6 biological replicates per group (2 clones per line and 3 biological replicates for each clone) from two independent differentiations of each line. EF CellROX staining in iGlut-mAst co-cultures. n = 5–6 coverslips per group (2 clones per line, 2–3 coverslips for each clone with 2–5 images per coverslip, shown are example images of CD07) from two independent differentiations of each line. G Neural allelic effect on mAst glutamate uptake diagram showing the transwell coculture system for glutamate uptake assay in mAst (upper panel) and the quantification (down panel). n = 6 biological replicates per group (2 clones per line, 3 biological replicates for each clone) from two independent differentiations of each line. H The schematic diagram (upper panel) shows the test for whether ROS inhibition can affect glutamate uptake in mAst in the transwell co-culture system; quantification of glutamate uptake assay after ROS inhibition in mAst. n = 6 biological replicates per group (2 clones per line, 3 biological replicates for each clone) from two independent differentiations of each line. I CLU immunodepletion assay confirms the role of CLU in glutamate uptake by mAst. Up panel, the diagram of the CLU immunodepletion assay; bottom-left panel, the culturing and assay timeline; bottom-right panel, the quantification of residual glutamate in glutamate uptake assay. n = 7 biological replicates per group from two independent assays (the supernatant was all from one clone in CD07 line). Note the similar levels of residual glutamate of the C/C group with CLU-depletion (C/C; IgG) and the T/T group upon CLU-depletion (T/T; Anti-CLU). J A graphic model of how the AD protective allele promotes neural CLU expression, subsequently facilitating neuron-glia lipid transfer and fine-tuning mAst glutamate uptake, thereby maintaining neuronal excitability. All statistical graphs depict mean ± SEM. Scale bars are indicated in corresponding image. * p < 0.05, ** p < 0.01, *** p < 0.001, and **** p < 0.0001

Update of

Similar articles

Cited by

References

    1. Scheltens P, Blennow K, Breteler MM, de Strooper B, Frisoni GB, Salloway S, Van der Flier WM. Alzheimer’s disease. Lancet. 2016;388:505–17. - PubMed
    1. Hollingworth P, Harold D, Sims R, Gerrish A, Lambert JC, Carrasquillo MM, Abraham R, Hamshere ML, Pahwa JS, Moskvina V, et al. Common variants at ABCA7, MS4A6A/MS4A4E, EPHA1, CD33 and CD2AP are associated with Alzheimer’s disease. Nat Genet. 2011;43:429–35. - PMC - PubMed
    1. Naj AC, Jun G, Beecham GW, Wang LS, Vardarajan BN, Buros J, Gallins PJ, Buxbaum JD, Jarvik GP, Crane PK, et al. Common variants at MS4A4/MS4A6E, CD2AP, CD33 and EPHA1 are associated with late-onset Alzheimer’s disease. Nat Genet. 2011;43:436–41. - PMC - PubMed
    1. Karch CM, Goate AM. Alzheimer’s disease risk genes and mechanisms of disease pathogenesis. Biol Psychiatry. 2015;77:43–51. - PMC - PubMed
    1. Lambert JC, Ibrahim-Verbaas CA, Harold D, Naj AC, Sims R, Bellenguez C, DeStafano AL, Bis JC, Beecham GW, Grenier-Boley B, et al. Meta-analysis of 74,046 individuals identifies 11 new susceptibility loci for Alzheimer’s disease. Nat Genet. 2013;45:1452–8. - PMC - PubMed