. 2025 May 3;13(1):91.
doi: 10.1186/s40478-025-02007-x.

Identification and characterization of tertiary lymphoid structures in brain metastases

Affiliations

Identification and characterization of tertiary lymphoid structures in brain metastases

Sadaf S Mughal et al. Acta Neuropathol Commun. .

Abstract

Brain metastases (BrM) are the most common cancers in the brain and linked to poor prognosis. Given the high incidence and often limited treatment options, understanding the complexity of the BrM tumor microenvironment is crucial for the development of novel therapeutic strategies. We performed transcriptome-wide gene expression profiling combined with spatial immune cell profiling to characterize the tumor immune microenvironment in 95 patients with BrM from different primary tumors. We found that BrM from lung carcinoma and malignant melanoma showed overall higher immune cell infiltration as compared to BrM from breast carcinoma. RNA sequencing-based immune cell deconvolution revealed gene expression signatures indicative of tertiary lymphoid structures (TLS) in subsets of BrM, mostly from lung cancer and melanoma. This finding was corroborated by multiplex immunofluorescence staining of immune cells in BrM tissue sections. Detection of TLS signatures was more common in treatment-naïve BrM and associated with prolonged survival after BrM diagnosis in lung cancer patients. Our findings highlight the cellular diversity of the tumor immune microenvironment in BrM of different cancer types and suggest a role of TLS formation for BrM patient outcome.

Keywords: Brain metastasis; Immune cell deconvolution; Multiplex immunofluorescence; Tertiary lymphoid structures; Tumor microenvironment.


Conflict of interest statement

Declarations. Ethical approval and consent to participate: The patients gave their written informed consent for the use of their tissue samples and associated clinical data for research purposes. The study was approved by the institutional review board of the Medical Faculty, Heinrich Heine University Düsseldorf (study number: 5717). Competing interest: SSM, YR, IH, LM, JF, SS, JM, KK, HW, GR, KHP, BB declare no conflict of interest. VM: research support from Novartis, Roche, Seagen, Genentech, Astra Zeneca and honoraria for lectures from Astra Zeneca, arsTempi, Daiichi-Sankyo, Eisai, Pfizer, MSD, Medac, Novartis, Roche, Seagen, Onkowissen, high5 Oncology, Lilly, Medscape, Gilead, Pierre Fabre, iMED Institute as well as consultancy honoraria from Roche, Pierre Fabre, PINK, ClinSol, Novartis, MSD, Daiichi-Sankyo, Eisai, Lilly, Seagen, Gilead, Stemline. AB: research support from Daiichi Sankyo, Roche and honoraria for lectures, consultation or advisory board participation from Roche Bristol-Meyers Squibb, Merck, Daiichi Sankyo, AstraZeneca, CeCaVa, Seagen, Alexion, Servier as well as travel support from Roche, Amgen and AbbVie. TF: received honoraria from Onkowissen, FOMF, Medconcept and travel support from Roche. DS: has offered consultation to Philogen, lnFlarX, Neracare, Merck Sharp & Dohme, Novartis, Bristol Myers Squibb, Pfizer, Pierre Fabre, Replimune, SunPharma, Daiichi Sanyo, Astra Zeneca, IQVIA, LabCorp, UltimoVacs, Seagen, Immunocore, Immatics, BioNTech, PamGene, BioAlta, Regeneron, Agenus, Erasca, Formycon, NoviGenix, CureVac, and Sanofi and has received research grants from Amgen, BMS, MSD, and Pfizer. Informed consent: Not applicable.

Figures

Fig. 1
Fig. 1
Bulk RNA sequencing-based immune cell deconvolution reveals heterogeneous cell populations in brain metastases of different primary origins. a Heatmap displaying the immune and stromal composition of brain metastases. Unsupervised hierarchical clustering of samples based on MCP-counter scores for the respective immune cell types shows six distinct immune classes (ICs). NK cells, Natural killer cells. b Comparison of Immune cell infiltration (ICI) scores among brain metastases from different origins (breast, lung, melanoma, kidney, colon). ICI scores were calculated based on the sum of MCP scores for immune cells only, excluding endothelial cells and fibroblast populations. Samples were assigned into high, intermediate and low immune cell infiltration groups based on tertiles scores. Statistical testing was performed using a two-sided Kruskal–Wallis test. Significance levels between groups are: ****, p ≤ 0.0001; ***, p ≤ 0.001; **, p ≤ 0.01; *, p ≤ 0.05; ns (not significant), p > 0.05. The p-values are corrected for multiple testing using Benjamini–Hochberg correction. Row and column clustering were enabled using the agglomerative hierarchical clustering method Agnes with an Euclidian distance metric and Wards linkage criterion. A legend illustrating the color coding of samples is provided on the left bottom
Fig. 2
Fig. 2
TLS signatures are a feature of the immune-rich BrM tumor microenvironment. Heatmap based on unsupervised hierarchical clustering of genes belonging to a TLS signature score, b costimulation markers, additionally included CD80 and CD86 which are part of TLS signature, c activation markers, d exhaustion markers, e M2 polarization markers. Patients are assigned to one of three TLS classes based on clustering into high (TLS3), intermediate (TLS2) and low expression (TLS1) of TLS signature genes. Statistical testing was performed using two-sided Kruskal–Wallis tests. Row and column clustering were enabled using the agglomerative hierarchical clustering method Agnes with an Euclidian distance metric and Wards linkage criterion. Legend for color coding is provided (bottom right). f TLS signature score distribution in BrM according to primary tumor type. The TLS score was derived by calculating the geometric means of the TLS signature genes. The boxplots display the distribution of TLS scores among BrM of different primary tumors. g Cytolytic score distribution in BrM according to the TLS classes. Cytolytic score is the log-average of GZMA and PRF1 normalized gene expression. Tumors belonging to the TLS3 (TLS high) class showed an overall higher cytolytic activity compared to TLS2 and TLS1 classes. Statistical testing was performed using an unpaired two-sided Wilcoxon test. The p-values are corrected for multiple testing using Benjamini–Hochberg correction. Legend for color coding is provided. Significance levels between groups are: ****, p ≤ 0.0001; ***, p ≤ 0.001; **, p < 0.01; *, p ≤ 0.05; ns (not significant), p > 0.05
Fig. 3
Fig. 3
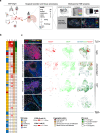
Identification of TLS in BrM tissues by multiplex immunofluorescence and spatial image analysis. a Cartoon displaying the BrM patient cohort investigated by multiplex immunofluorescence and the multispectral tumor microenvironment (TME) analysis. Formalin-fixed and paraffin-embedded (FFPE) BrM tissue samples of 60 patients were investigated by multiplex immunofluorescence using the antibody panel and technology platform as illustrated (for further details see Materials and Methods). Created with BioRender.com b Heatmap displaying BrM origins (1), B and T lymphocyte frequencies (2, 3), aggregation pattern (4), and TLS scores (5) in 60 BrM patient samples. c Representative composite images showing the Opal multiplex immunofluorescence results employing the 7-plex BrM TLS panel with antibodies directed against CD3, CD20, CD163, Lamp3, vWF, pan-cytokeratin (pCK) or Mel A, and DAPI in selected BrM of different primary tumor origin. Whole slide spatial plots display the distribution of CD20 + and CD3 + leukocytes, and their overlay with CD163 + macrophages in selected cases of a lung carcinoma BrM, a breast carcinoma BrM, and a melanoma BrM with TLS frequencies ranging from high to low. Scale bars: 50 µm
Fig. 4
Fig. 4
Activated transcriptional programs in the TLS-positive tumors and prognostic impact of TLS in BrM. a Differentially expressed genes (DEG) between TLS positive and TLS negative tumors using RNAseq data. Volcano plot showing upregulated and downregulated genes in TLS positive tumors (n = 31). A cut-off of gene expression fold change of ≥ 2 or ≤ 2 and a false discovery rate (FDR) q ≤ 0.05 was applied to filter DEGs, and a few genes are labeled. b Gene set enrichment analysis based on DEGs displays the activated and suppressed transcriptional programs in TLS positive tumors. The size of the dot represents the gene count and the adjusted p-values are shown as color gradient on the right. c Expression differences in selected immunotherapy-relevant gene markers and lymphotoxin genes in TLS positive and negative cases. Box plots display TPM normalized gene expression values. Significance levels between groups are: ****, p ≤ 0.0001; ***, p ≤ 0.001; **, p ≤ 0.01; * p ≤ 0.05; ns (not significant), p > 0.05. d Kaplan–Meier survival estimation for lung BrM patients stratified according to RNAseq-based TLS signature score. Overall survival (OS) is calculated from the diagnosis of the resected BrM. TLS status is color-coded on top. e Kaplan–Meier survival estimation of OS following the diagnosis of BrM in a published cohort of lung BrM patients [43]. TLS status was determined using the RNA-based TLS signature scores. The p-value was calculated using the log-rank method

References

    1. Achrol AS, Rennert RC, Anders C, Soffietti R, Ahluwalia MS, Nayak L, Peters S, Arvold ND, Harsh GR, Steeg PS, Chang SD (2019) Brain metastases. Nat Rev Dis Primers 5:5. 10.1038/s41572-018-0055-y - PubMed
    1. Barnholtz-Sloan JS, Sloan AE, Davis FG, Vigneau FD, Lai P, Sawaya RE (2004) Incidence proportions of brain metastases in patients diagnosed (1973 to 2001) in the metropolitan detroit cancer surveillance system. JCO 22:2865–2872. 10.1200/JCO.2004.12.149 - PubMed
    1. Becht E, Giraldo NA, Lacroix L, Buttard B, Elarouci N, Petitprez F, Selves J, Laurent-Puig P, Sautès-Fridman C, Fridman WH, De Reyniès A (2016) Estimating the population abundance of tissue-infiltrating immune and stromal cell populations using gene expression. Genome Biol 17:218. 10.1186/s13059-016-1070-5 - PMC - PubMed
    1. Boire A, Brastianos PK, Garzia L, Valiente M (2020) Brain metastasis. Nat Rev Cancer 20:4–11. 10.1038/s41568-019-0220-y - PubMed
    1. Brastianos PK, Kim AE, Giobbie-Hurder A, Lee EQ, Lin NU, Overmoyer B, Wen PY, Nayak L, Cohen JV, Dietrich J, Eichler A, Heist RS, Krop I, Lawrence D, Ligibel J, Tolaney S, Mayer E, Winer E, Bent B, De Sauvage MA, Ijad N, Larson JM, Marion B, Nason S, Murthy N, Ratcliff S, Summers EJ, Mahar M, Shih HA, Oh K, Cahill DP, Gerstner ER, Sullivan RJ (2023) Pembrolizumab in brain metastases of diverse histologies: phase 2 trial results. Nat Med 29:1728–1737. 10.1038/s41591-023-02392-7 - PMC - PubMed

Publication types

LinkOut - more resources