

Molecular and immune landscape of melanoma: a risk stratification model for precision oncology
- PMID: 40319421
- PMCID: PMC12050255
- DOI: 10.1007/s12672-025-02497-0
Molecular and immune landscape of melanoma: a risk stratification model for precision oncology
Abstract
Background: Melanoma is a highly aggressive skin cancer with significant heterogeneity in immune infiltration and clinical outcomes. Accurate risk stratification is essential for improving personalized treatment strategies.
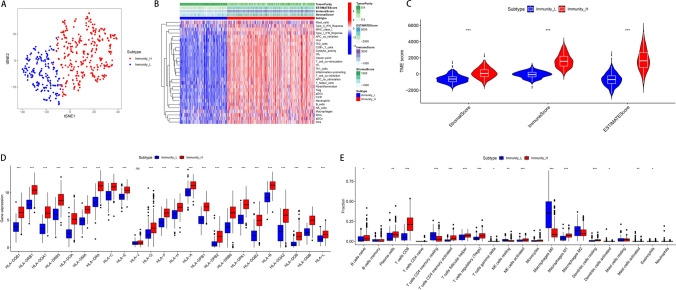
Methods: This study utilized data from The Cancer Genome Atlas (TCGA) to explore immune-related gene expression in melanoma. Single-sample gene set enrichment analysis (ssGSEA) was employed to classify patients into high and low immune groups. Tumor microenvironment (TME) characteristics, including immune cell infiltration, HLA gene expression, and TME scores, were analyzed. Prognostic genes were identified using univariate and multivariate Cox regression analyses. A risk score model and nomogram were constructed, and gene set enrichment analysis (GSEA) and gene set variation analysis (GSVA) were conducted to explore relevant signaling pathways.
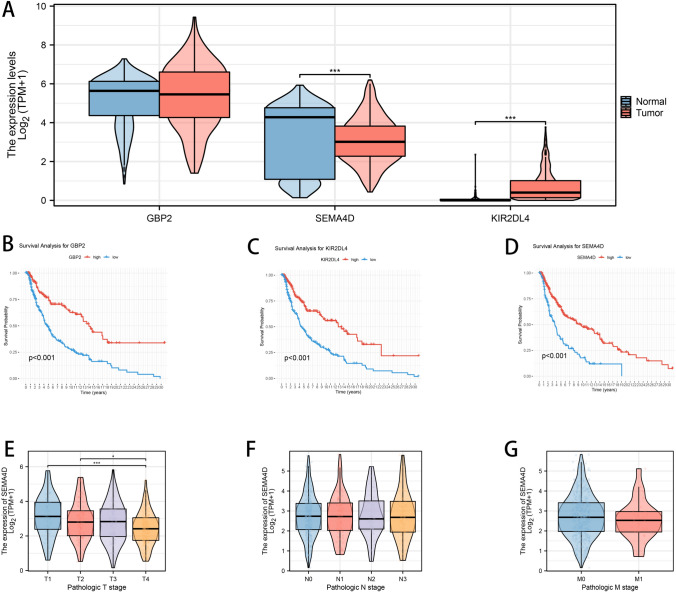
Results: ssGSEA-based classification revealed significant differences between high and low immune groups in terms of immune infiltration and HLA gene expression. The risk model incorporated immune-related genes such as GBP2, SEMA4D, and KIR2DL4, which demonstrated distinct tumor expression profiles and strong prognostic value. GSEA and GSVA analyses uncovered critical immune-related and oncogenic pathways linked to risk stratification. A predictive nomogram integrating molecular risk scores and clinical variables improved prognostic accuracy. Computational immune deconvolution highlighted CD8+ T cell infiltration as a key prognostic factor. To validate the functional role of candidate genes, KIR2DL4 was silenced in A375 melanoma cells using shRNA. Knockdown efficiency was confirmed by qRT-PCR. Functional assays revealed that KIR2DL4 silencing significantly reduced cell proliferation, as assessed by MTT assay, and impaired migratory capacity, as demonstrated by wound healing assay. These in vitro findings support the computational predictions and suggest that KIR2DL4 may play a tumor-promoting role in melanoma.
Conclusion: This study provides a robust immune-related prognostic model for melanoma. It underscores the value of immune gene expression and T cell infiltration, particularly CD8+ T cells, in predicting patient outcomes. The model facilitates personalized treatment decisions and advances precision oncology approaches in melanoma. The integration of transcriptomic analysis with experimental validation confirms the tumor-promoting role of KIR2DL4 and enhances the translational value of the model in guiding precision immunotherapy.
Keywords: Gene expression profiling; Immune infiltration; Melanoma stratification; Prognostic biomarkers; TCGA data analysis.
© 2025. The Author(s).
Conflict of interest statement
Declarations. Ethics approval and consent to participate: Not applicable. Consent for publication: Not applicable. Competing interests: The authors declare no competing interests.
Figures


References
-
- Amaria RN, Postow M, Burton EM, Tetzlaff MT, Ross MI, Torres-Cabala C, Glitza IC, Duan F, Milton DR, Busam K, Simpson L, McQuade JL, Wong MK, Gershenwald JE, Lee JE, Goepfert RP, Keung EZ, Fisher SB, Betof-Warner A, Shoushtari AN, Callahan M, Coit D, Bartlett EK, Bello D, Momtaz P, Nicholas C, Gu A, Zhang X, Korivi BR, Patnana M, Patel SP, Diab A, Lucci A, Prieto VG, Davies MA, Allison JP, Sharma P, Wargo JA, Ariyan C, Tawbi HA. Neoadjuvant relatlimab and nivolumab in resectable melanoma. Nature. 2022;611(7934):155–160. 10.1038/s41586-022-05368-8. Erratum in: Nature. 2023;615(7953):E23. 10.1038/s41586-023-05892-1.
-
- Hyeraci M, Papanikolau ES, Grimaldi M, Ricci F, Pallotta S, Monetta R, Minafò YA, Di Lella G, Galdo G, Abeni D, Fania L, Dellambra E. Systemic photoprotection in melanoma and non-melanoma skin cancer. Biomolecules. 2023;13(7):1067. 10.3390/biom13071067.PMID:37509103;PMCID:PMC10377635. - PMC - PubMed
-
- Heistein JB, Acharya U, Mukkamalla SKR. Malignant melanoma. Treasure Island (FL): StatPearls Publishing; 2024. - PubMed
LinkOut - more resources
Full Text Sources
Research Materials