. 2025 May 4;16(1):4156.
doi: 10.1038/s41467-025-59473-z.

Anterior cingulate cortex parvalbumin and somatostatin interneurons shape social behavior in male mice

Affiliations

Anterior cingulate cortex parvalbumin and somatostatin interneurons shape social behavior in male mice

Chuchu Qi et al. Nat Commun. .

Abstract

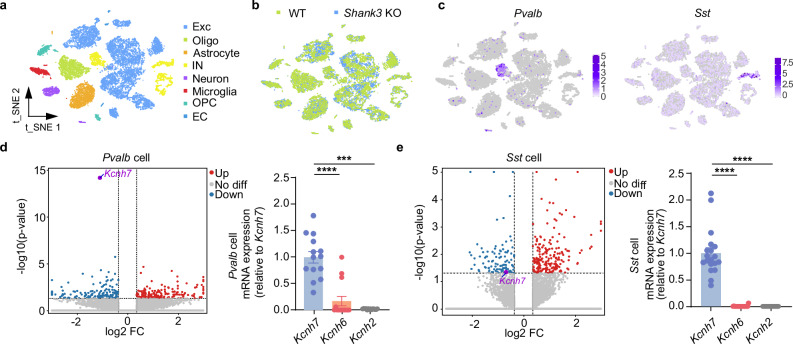
The anterior cingulate cortex (ACC) is essential for social behavior, and its dysfunction is implicated in social interaction deficits in autism. Pyramidal neuron activity in the ACC is modulated by parvalbumin (PV) and somatostatin (SST) interneurons, though their specific roles in social interactions remain unclear. Here, we demonstrate that PV and SST interneurons differentially contribute to the regulation of social interactions. In a Shank3-deficient autistic model, the expression of Kcnh7, a risk gene for autism, is reduced in both PV and SST interneurons. Knocking out Kcnh7 in either interneuron subtype leads to social interaction deficits. Furthermore, projections from the lateral posterior thalamic nucleus (mediorostral part, LPMR) to PV interneurons and from the ventral hippocampus (vHPC) to SST interneurons differentially modulate social interactions. These findings provide new insights into the distinct roles of PV and SST interneurons in social processes and their contributions to autism-related pathophysiology.


Conflict of interest statement

Competing interests: The authors declare no competing interests.

Figures

Fig. 1
Fig. 1. The activity of PV and SST interneurons varies during different phases of social interactions.
a Schematic diagram of AAV-FLEX-GCaMP7s injection (The 3D brain image was created with CEBSIT/ION Digital Brain https://www.digital-brain.cn/). b Example image showing fiber placement in the ACC (left) and GCaMP7s expression (right). c Same as (b) but for SST-Cre mice. d Cartoon depicting the social recognition behavior in the home cage test. e Ca2+ signals associated with social recognition in (d). Left: heatmap of Ca2+ signals, with each row representing one mouse. Right: the peri-event plot of the average Ca2+ transients: thick lines indicate the mean, shaded areas represent the SEM (n = 11 mice). f Same as (e) but for SST-Cre mice, n = 11 mice. g Schematic diagram of the three-chamber sociability test. h, i Same as (e) but for PV-Cre (h, n = 9 mice) and SST-Cre (i, n = 11 mice) mice in the sociability test. j, k, l Same as (g, h, i) but for PV-Cre (k, n = 9 mice) and SST-Cre (l, n = 11 mice) mice in social preference test. Schematic diagrams in (d, g, j) are designed by us. m Comparison of AUC (area under curve) (left) and the correlation index between social duration and neuronal activity in the PV-Cre and SST-Cre groups (right) (n = 11 mice per group, two-tailed unpaired t test, t = −3.665, P = 0.002; Pearson correlation test, r = −0.623, P = 0.041 for PV, r = −0.635, P = 0.036 for SST). n Same as (m) but for sociability (n = 9 PV-Cre mice, n = 11 SST-Cre mice, two-tailed unpaired t test, t = −3.087, P = 0.014; Pearson correlation test, r = −0.807, P = 0.009 for PV, r = −0.910, P = 0.0001 for SST). o Same as (m) but for social preference (n = 9 PV-Cre mice, n = 11 SST-Cre mice, two-tailed unpaired t test, t = 2.656, P = 0.020; Pearson correlation test, r = −0.895, P = 0.001 for PV, r = −0.875, P < 0.0001 for SST). All statistical tests are two-sided. Data are presented as mean ± SEM. *P < 0.05, **P < 0.01. Source data are provided as a Source Data File.
Fig. 2
Fig. 2. Apoptosis of PV and SST interneurons in the ACC induced by virus alters behavior in the three-chamber test.
a Schematic diagram of virus injection (The 3D brain image was created with CEBSIT/ION Digital Brain https://www.digital-brain.cn/). b Timeline of the experimental procedure. c Representative immunofluorescence images. d Number of PV+ cells (left) and Pvalb mRNA levels (right) (left: n = 6 slices from 2 mice per group, two-tailed unpaired t test, t = 39.703, P < 0.0001; right: n = 7 control mice, n = 15 taCasp3 mice, Two-sided Mann‒Whitney U test, Z = −3.702, P = 0.0002). e Same as (d) but for SST-Cre mice (left: n = 6 slices from 2 mice per group, two-tailed unpaired separate variance estimation t test, t = 12.494, P < 0.0001; right: n = 10 mice for the control and n = 15 mice for taCasp3, two-tailed unpaired t test, t = 73.364, P < 0.0001). f Traces of PV-Cre mice before (left) and after (right) viral intervention in the sociability test. g Quantification of time spent in the social zone and empty zone before and after viral intervention for PV-Cre mice (n = 8 mice per group; two-tailed paired t test, t = 3.519, P = 0.0097 for Pre; Two-sided Wilcoxon signed-rank test, Z = −2.521, P = 0.012 for Post). h Discrimination score for PV-Cre mice in (g) (n = 8 mice, two-tailed paired t test, t = −2.698, P = 0.031). i Quantification of time spent in the stranger zone and original zone before and after viral intervention for PV-Cre mice (n = 8 mice, two-tailed paired t test, t = 3.220, P = 0.015 for Pre, t = 0.620, P = 0.555 for Post). j Discrimination score for PV-Cre mice in (i) (n = 8 mice, two-tailed paired t test, t = 2.337, P = 0.052). k Same as (g) but for SST-Cre mice (n = 8 mice; two-tailed paired t test, t = 4.024, P = 0.005 for Pre; t = 11.084, P < 0.0001 for Post). l Same as (h) but for SST-Cre (n = 8 mice, Two-sided Wilcoxon signed-rank test, Z = −0.560, P = 0.575). m Traces of SST-Cre mice before (left) and after (right) viral intervention in the social preference test. n Same as (i) but for SST-Cre mice (n = 8 mice; two-tailed paired t test, t = 6.899, P = 0.0002 for Pre; t = 11.919, P < 0.0001 for Post). o Same as (j) but for SST-Cre mice (n = 8 mice, two-tailed paired t test, t = −3.615, P = 0.0086). All statistical tests are two-sided. Data are presented as mean ± SEM. *P < 0.05, **P < 0.01, ***P < 0.001, ****P < 0.0001. Source data are provided as a Source Data File.
Fig. 3
Fig. 3. Optogenetic activation of PV or SST interneurons suppresses social behavior in the home cage test.
a Schematic diagram of AAV- DIO-ChR2 injection into the ACC of PV-Cre mice and SST-Cre mice (left, the 3D brain image was created with CEBSIT/ION Digital Brain https://www.digital-brain.cn/) and diagram of the home cage test with laser delivery strategy (right panel is designed by us). b Optogenetic stimulation of PV interneurons modulates social behaviors in the home cage test. Left: The raster plot of different types of social behavior in the home cage test; B body contact, F following, G genital contact, N nose contact. Right: Statistical analysis of total social interaction time (n = 10 mice, Friedman’s M test, Χ2 = 15.800, P = 0.0004). c Same as (b) but for SST-Cre mice (n = 9 mice, Friedman’s M test, Χ2 = 16.222, P < 0.0001). d Comparison of slope coefficient in the PV-Cre, SST-Cre and Cre negative groups: X-axis: STON (social time when laser ON) -STOFF1 (social time during OFF1)/TT (total time of test); Y-axis: STOFF2 (social time during OFF2)- STON (social time when laser ON)/TT (total time of test) (n = 10 mice, Spearman correlation test, r = −0.055, P = 0.881 for PV; n = 9 mice, Pearson correlation test, r = −0.133, P = 0.732 for SST; n = 6 mice, Pearson correlation test, r = 0.922, P = 0.009 for Cre negative). e Comparison of the social inhibition index between the PV-Cre and SST-Cre groups (n = 10 PV-Cre mice, n = 9 SST-Cre mice, two-tailed unpaired t test, t = 3.046, P = 0.007). f Summary data of the time spent with toys for PV-Cre group in the OFF1, ON and OFF2 stages in the home cage (n = 10 mice, Friedman’s M test, Χ2 = 0.800, P = 0.670). g Same as (f) but for SST-Cre group (n = 9 mice, repeated-measures ANOVA, Fbetween group = 0.375, P = 0.693). All statistical tests are two-sided. Data are presented as mean ± SEM. *P < 0.05, **P < 0.01, ***P < 0.001. Source data are provided as a Source Data File.
Fig. 4
Fig. 4. Optogenetic activation of PV or SST interneurons suppresses social interactions in the three-chamber.
a Traces of PV-Cre mice in the sociability test. b, c Social interaction time (b) and discrimination score (c) from the sociability test (n = 9 mice, Wilcoxon signed-rank test, Z = −2.666, P = 0.008 for OFF1; two-tailed paired t test, t = −2.516, P = 0.036 for ON; two-tailed paired t test, t = 1.544, P = 0.161 for OFF2; two-tailed paired t test, t = 6.805, P = 0.0001 for discrimination score). d Traces of PV-Cre mice in the social preference test. e, f Same as (b, c) but in the social preference test (n = 9 mice, two-tailed paired t test, t = 6.831, P = 0.0001 for OFF1; t = 0.827, P = 0.432 for ON; t = 0.830, P = 0.431 for OFF2; t = 3.833, P = 0.005 for discrimination score). g Same as (a) but for SST-Cre mice. h, i Same as (b, c) but for SST-Cre mice (n = 10 mice, two-tailed paired t test, t = 4.804, P = 0.001 for OFF1; t = 0.236, P = 0.819 for ON; t = 4.666, P = 0.001 for OFF2; t = 3.686, P = 0.005 for discrimination score). j Same as (d) but for SST-Cre mice. k, l Same as (e, f) but for SST-Cre mice (n = 10 mice, Wilcoxon signed-rank test, Z = −2.803, P = 0.005 for OFF1, Z = −2.191, P = 0.028 for ON; two-tailed paired t test, t = −1.110, P = 0.296 for OFF2, t = 6.661, P < 0.0001 for discrimination score). m Delay time when the first social behavior stopped during the sociability test (n = 9 PV-Cre mice, n = 8 SST-Cre mice; two-tailed unpaired t test, t = −2.816; P = 0.013). n Comparison of normalized discrimination scores in the sociability test (n = 9 PV-Cre mice, n = 10 SST-Cre mice, two-tailed unpaired t test, t = −1.863, P = 0.079). o Delay time when the first social behavior stopped in the stranger zone (n = 9 PV-Cre mice, n = 10 SST-Cre mice, Mann‒Whitney U test, Z = −2.195, P = 0.028). p, q Time spent in the center zone for PV-Cre (p) and SST-Cre (q) in the social preference test (n = 9 mice, repeated-measures ANOVA, P = 0.001 for PV; n = 10 mice, Friedman’s M test, Χ2 = 3.800, P = 0.150 for SST). r Same as (n) but in the social preference test (n = 9 PV-Cre mice, n = 10 SST-Cre mice; two-tailed unpaired t test, t = −3.164, P = 0.006). All statistical tests are two-sided. Data are presented as mean ± SEM. *P < 0.05, **P < 0.01, ***P < 0.001, ****P < 0.0001. Source data are provided as a Source Data File.
Fig. 5
Fig. 5. Decreased levels of Kcnh7 in PV and SST interneurons within the ACC of Shank3 KO mice.
a, b t-SNE plots of WT and Shank3 KO groups showing cell clusters, including oligodendrocyte (Oligo), oligodendrocyte precursor cell (OPC), endothelial cell (EC), interneuron (IN), and excitatory neuron (Exc). c Feature plots showing single-cell gene expression of known inhibitory neuron markers (Pvalb, left; Sst, right). d Volcano plot showing that Kcnh7 is one of the downregulated differentially expressed genes in Shank3 KO mice compared to the WT mice in PV interneurons, identified by scRNA-seq (left). Relative mRNA expression showing that Kcnh7 is more prominently in Pvalb-positive neurons compared to Kcnh6 and Kcnh2 (right, n = 14 cells from 2 mice: Kruskal‒Wallis H test, Χ2 = 24.783, P < 0.0001). e Same as (d) but for Sst neurons (n = 19 cells from 2 mice; Kruskal‒Wallis H test, Χ2 = 41.128, P < 0.0001). All statistical tests are two-sided. Data are presented as mean ± SEM. ***P < 0.001, ****P < 0.0001. Source data are provided as a Source Data File.
Fig. 6
Fig. 6. Increased excitability and decreased Kv11.3 current in PV and SST interneurons within the ACC of Shank3 KO mice.
a RNAscope showing Kcnh7 (gray) and Pvalb (red) expression in WT (left) and Shank3 KO mice (middle), with the quantification of Kcnh7+/Pvalb+ ratio (right, n = 7 slices from 2 mice). b Normalized fluorescence intensity of Kcnh7 (left) and normalized number of Kcnh7+ puncta (right) in Pvalb+ neurons (n = 13 cells in WT and n = 12 cells in KO from 3 mice per group; Mann‒Whitney U test, Z = −2.940, P = 0.003 for intensity; two-tailed unpaired t test, t = 3.811; P = 0.0009 for puncta number). c Action potential trace at 200 pA in PV-tdTomato mice. d Input‒output curve (left) and spike frequency at 380 pA (right) (Stim. int.: stimulus intensity; n = 9 cells in WT and n = 10 cells in KO from 3 mice per group, Friedman’s M test, Χ2between group = 27.676, Pbetween group < 0.0001, Χ2within group = 354.809, Pwithin group < 0.0001 for input‒output; two-tailed unpaired t test, t = −4.274, P = 0.0005 for frequency at 380 pA). e Representative traces of the Kv11.3 current (left) and quantification (right) (n = 4 cells for the WT and n = 3 cells for the KO group from 2 mice per group; two-tailed unpaired t test, t = −8.416, P = 0.002). f Same as (a) but for Sst+ interneurons (right, n = 6 slices from 2 mice). g Same as (b) but for Sst+ interneurons (n = 11 cells for the WT and n = 12 cells for the KO from 3 mice per group, two-tailed unpaired t test, t = 2.583, P = 0.017 for intensity, t = 2.724, P = 0.013 for puncta number). h Same as (c) but for SST-Cre::Ai9 neurons. i Same as (d) but for SST-Cre::Ai9 neurons (n = 9 cells in WT and n = 8 cells in KO from 3 mice per group, Friedman’s M test, Χ2between group = 76.699, Pbetween group < 0.0001, Χ2within group = 297.776, Pwithin group < 0.0001 for input‒output; two-tailed unpaired t test, t = −5.013, P < 0.0001 for frequency at 380 pA). j Same as (e) but for SST-Cre::Ai9 neurons (n = 3 cells in WT and n = 4 cells in KO from 2 mice per group, two-tailed unpaired t test, t = -3.350, P = 0.020). All statistical tests are two-sided. Data are presented as mean ± SEM. *P < 0.05, **P < 0.01, ***P < 0.001, ****P < 0.0001. Source data are provided as a Source Data File.
Fig. 7
Fig. 7. CRISPR-Cas9-mediated Kcnh7 knock out in PV and SST interneurons enhances neuronal excitability.
a Schematic of the CRISPR-Cas9 viral strategy used to target Kcnh7 in PV and SST interneurons (The 3D brain image was created with CEBSIT/ION Digital Brain https://www.digital-brain.cn/). b Representative images of PV-Cre mice showing AAV-sgRNA-hSyn-GFP expression (left) and KCNH7 expression in the control group (middle) and Cas9 virus group (right). c Over 99% of PV+ neurons expressed GFP, indicating successful viral infection (n = 6 slices for 2 mice per group). d Quantification of KCNH7 protein levels showing a significant reduction in the Cas9 group compared to the control group (n = 10 cells for Control and n = 9 cells for Cas9 from 2 mice per group; Mann‒Whitney U test, Z = −2.776; P = 0.006). e Ex vivo electrophysiological recordings from PV-Cre::Ai9 neuron. f, g Representative traces of action potential (f), half width (g left, middle) and fAHP (g right) in PV-Cre::Ai9 cells (n = 13 cells per group from 3 mice; two-tailed unpaired t test, t = −4.342, P = 0.0004 for half width; two-tailed unpaired t test, t = −2.914, P = 0.008 for fHAP). h Input‒output curve of PV-Cre::Ai9 neurons, showing increased spike frequency in the Cas9 group compared to the control group (n = 9 control cells and n = 12 Cas9 cells from 3 mice per group; Friedman’s M test; Χ2between group = 26.390; Pbetween group < 0.0001; Χ2within group = 346.474; Pwithin group < 0.0001). i Same as (b) but for SST-Cre mice. j Over 99% of SST+ neurons expressed GFP, indicating successful viral infection (n = 6 slices for 2 mice per group). k Significant reduction in KCNH7 protein levels in the Cas9 group compared to the control group (n = 9 cells from 2 mice per group, two-tailed unpaired t test, t = 4.189, P = 0.0007). l–n Same as (e–g) but for SST-Cre::Ai9 cells (n = 16 cells for control and n = 12 cells for Cas9 from 3 mice per group; two-tailed unpaired t test, t = −4.568, P = 0.0001 for half width; Mann‒Whitney U test, Z = −2.971, P = 0.003 for fHAP). o Same as (h) but for SST-Cre::Ai9 cells (n = 10 cells for control and n = 12 cells for Cas9 from 3 mice per group; Friedman’s M test, Χ2between group = 111.364; Pbetween group < 0.0001, Χ2within group = 330.163, Pwithin group < 0.0001). All statistical tests are two-sided. Data are presented as mean ± SEM. **P < 0.01, ***P < 0.001, ****P < 0.0001. Source data are provided as a Source Data File.
Fig. 8
Fig. 8. Knockout of Kcnh7 by CRISPR-Cas9 in PV and SST interneurons impairs social interaction.
a Time spent in the social zone and empty zone before and after viral intervention in PV-Cre mice during the sociability test (n = 9 mice, Wilcoxon signed-rank test, Z = −2.666, P = 0.008 for Pre; two-tailed paired t test, t = 0.787, P = 0.454 for Post). b Comparison of discrimination score for PV-Cre mice in the sociability test (n = 9 mice, two-tailed paired t test, t = 4.775, P = 0.001). c Time spent in the stranger zone and original zone before and after viral intervention in PV-Cre mice during the social preference test (n = 9 mice, Wilcoxon signed-rank test, Z = −2.547, P = 0.011 for Pre; two-tailed paired t test, t = 2.858, P = 0.021 for Post). d Comparison of discrimination score for PV-Cre mice in the social preference test (n = 9 mice, two-tailed paired t test, t = 0.651, P = 0.533). e Time spent in the social zone and empty zone before and after viral intervention in SST-Cre mice during the sociability test (n = 8 mice, two-tailed paired t test, t = 4.151, P = 0.004 for Pre, t = 1.855, P = 0.106 for Post). f Comparison of discrimination score for SST-Cre mice in the sociability test (n = 8 mice, two-tailed paired t test, t = 3.874, P = 0.006). g Time spent in the stranger zone and original zone before and after viral intervention in SST-Cre mice during the social preference test (n = 8 mice, Wilcoxon signed-rank test, Z = −2.521, P = 0.012 for Pre; two-tailed paired t test, t = −3.765, P = 0.007 for Post). h Comparison of discrimination score for SST-Cre mice in the social preference test (n = 8 mice, two-tailed paired t test, t = 7.011, P = 0.0002). All statistical tests are two-sided. Data are presented as mean ± SEM. *P < 0.05, **P < 0.01, ***P < 0.001. Source data are provided as a Source Data File.
Fig. 9
Fig. 9. Retrograde monosynaptic tracing reveals that the LPMR and vHPC preferentially project to PV and SST interneurons in the ACC.
a Schematic of experimental design (The 3D brain image was created with CEBSIT/ION Digital Brain https://www.digital-brain.cn/ and the right panel is designed by us). b Representative images showing the starter neurons in ACC from a PV-Cre and a SST-Cre mice. c Representative images showing starter neurons in the ACC co-expressing AAV-helper (His-EGFP, oRVG), RV-dsRed, and PV or SST (gray) (n = 6 slices from 3 mice per group). d PV interneurons in the ACC receive direct inputs from the LPMR (top), while SST interneurons in the ACC receive direct inputs from the vHPC (bottom). Images are from representative animals of each group. e Quantification of principal starter neurons (expressing His-EGFP and RV-dsRed) in the ACC and PFC (n = 6 mice per group). The value 1.00 indicates all detected starter neurons. f Analysis of RV-dsRed-positive cell density in upstream brain region (n = 5 mice per group). Po posterior thalamic nuclear, LPMR lateral posterior thalamic nucleus, mediorostral part, Cl/DEn claustrum/dorsal endopiriform nucleus, MD mediodorsal thalamus, HDB/VDB nucleus of the horizontal/vertical limb of the diagonal band, VL/AM ventrolateral thalamic nucleus/anteromedial thalamic nucleus, dHPC dorsal hippocampus, vHPC ventral hippocampus. Data are presented as mean ± SEM. Source data are provided as a Source Data File.
Fig. 10
Fig. 10. Selective activation of the LPMR-PV (ACC) or vHPC-SST (ACC) projection impairs social interaction.
a Schematic diagram of virus strategy and optic fibers implantation site. b Injection site in LPMR (left) and ACC (right). c AAV1 expression in LPMR (top) and co-labeling of AAV1-EGFP and ChR2-mCherry in ACC of PV-Cre mice (bottom). d Social interaction time in the home cage test (n = 7 mice, repeated-measures ANOVA, Fbetween group = 78.499, P < 0.0001). e, f Social interaction time between the ChR2 and mCherry control groups in different laser stages (e: n = 7 mice for ChR2, n = 6 mice for mCherry; repeated-measures ANOVA, Fbetween group = 36.693, P < 0.0001, Fwithin group = 111.555, P < 0.0001) and quantification of social time when the laser ON (f: two-tailed unpaired t test, t = −10.678, P < 0.0001). g Representative movement traces of PV-Cre mice during the sociability test. h, i Social interaction time of PV-Cre mice during different laser stages (h: n = 9 mice, Wilcoxon signed-rank test, Z = −2.547, P = 0.011 for laser OFF1; two-tailed paired t test, t = −1.644, P = 0.139 for laser ON, t = 4.843, P = 0.001 for laser OFF2) and discrimination score between the OFF1 and ON phases (i: n = 9 mice, Wilcoxon signed-rank test, Z = −2.547, P = 0.011). j Same experimental design as in a but for SST-Cre mice. k Representative images showing the injection site in vHPC (left) and ACC (right). l AAV1 expression in vHPC (top) and co-labeling of AAV1-EGFP and ChR2-mCherry in ACC of SST-Cre mice (bottom). m Representative movement traces of SST-Cre mice during the social preference test. n–o Social time of SST-Cre mice in social preference test (n: n = 8 mice; two-tailed paired t test, t = 5.238, P = 0.0012 for laser OFF1; t = −4.202, P = 0.004 for laser ON; t = 3.420, P = 0.011 for laser OFF2) and the discrimination score between the OFF1 and ON phases (o: n = 8 mice, two-tailed paired t test, t = 10.065, P < 0.0001). p, q Social interaction time between ChR2 and mCherry control groups in the original zone for SST-Cre mice (p: n = 8 mice for ChR2, n = 6 mice for mCherry; repeated-measures ANOVA, Fbetween group = 5.978, P = 0.031, Fwithin group = 5.444, P = 0.011) and quantification of social interaction time when the laser was ON (q: two-tailed unpaired t-test, t = 3.788, P = 0.003). The 3D images of (a, j) were created with CEBSIT/ION Digital Brain https://www.digital-brain.cn/. All statistical tests are two-sided. Data are presented as mean ± SEM. *P < 0.05, ** P < 0.01, **** P < 0.0001. Source data are provided as a Source Data File.

References

    1. Chen, P. & Hong, W. Neural circuit mechanisms of social behavior. Neuron98, 16–30 (2018). - PMC - PubMed
    1. Moy, S. S. et al. Sociability and preference for social novelty in five inbred strains: an approach to assess autistic-like behavior in mice. Genes Brain Behav.3, 287–302 (2004). - PubMed
    1. Jang, S. et al. Impact of the circadian nuclear receptor REV-ERBα in dorsal raphe 5-HT neurons on social interaction behavior, especially social preference. Exp. Mol. Med.55, 1806–1819 (2023). - PMC - PubMed
    1. Tian, R. et al. Modeling SHANK3-associated autism spectrum disorder in Beagle dogs via CRISPR/Cas9 gene editing. Mol. Psychiatry28, 3739–3750 (2023). - PubMed
    1. Ariyasiri, K. et al. Pharmacological (ethanol) and mutation (sam2 KO) induced impairment of novelty preference in zebrafish quantified using a new three-chamber social choice task. Prog. Neuro-Psychopharmacol. Biol. Psychiatry88, 53–65 (2019). - PubMed

MeSH terms

LinkOut - more resources