. 2025 May 4;16(1):668.
doi: 10.1007/s12672-025-02393-7.

Synergistic bioinformatics and sophisticated machine learning unveil ferroptosis-driven regulatory pathways and immunotherapy potential in breast carcinoma

Affiliations

Synergistic bioinformatics and sophisticated machine learning unveil ferroptosis-driven regulatory pathways and immunotherapy potential in breast carcinoma

Lei Xia et al. Discov Oncol. .

Abstract

Background: The intersection of aberrant iron metabolism and the rapidly advancing field of immunotherapy has emerged as a critical focus in breast cancer (BRCA) therapeutics. Ferroptosis, a distinct form of iron-dependent cell death driven by lipid peroxidation, has garnered increasing attention for its pivotal role in cancer progression.

Methods: Utilizing extensive datasets from TCGA and GEO, this research extracted a wealth of biological data, including mRNA splicing indices, genomic aberrations, copy number variations (CNV), tumor mutational burden (TMB), and diverse clinical information. Through precise Lasso regression analysis, this research constructed a prognostic model that elucidates the molecular interactions of FRGs in BRCA. Concurrent co-expression network analyses were performed to explore the dynamic interplay between gene expression patterns and FRGs, revealing potential regulatory mechanisms.

Results: This research analysis revealed significant overexpression of FRGs in high-risk BRCA samples, highlighting their prognostic relevance beyond traditional clinical parameters. GSVA identified immune response and cancer-related pathways as predominantly active in high-risk groups, suggesting ferroptosis as a central modulator within the tumor microenvironment. Notably, genes such as ACTL8, VGF, and CPLX2 emerged as markers of tumorigenesis, while IL33 and TP63 were identified as potential key regulators of cancer progression, each exhibiting distinct expression profiles across risk levels. Furthermore, this research incorporated gene correlations, CNV profiles, SNP arrays, and drug susceptibility analyses, contributing to the advancement of precision oncology.

Conclusions: The integration of bioinformatics and machine learning in this study underscores a strong correlation between FRG expression patterns and BRCA prognosis, affirming their potential as precise biomarkers for personalized immunotherapy.

Keywords: BRCA; CNV; Drug prediction; Drug prediction; Ferroptosis; Immune checkpoint; Immunity; m6a.


Conflict of interest statement

Declarations. Ethics approval and consent to participation: This manuscript is not a clinical trial, hence the ethics approval and consent to participation is not applicable. Consent for publication: Not applicable. Competing interests: The authors declare no competing interests.

Figures

Fig. 1
Fig. 1
Framework. The data of BRCA patients were obtained from TCGA and GEO databases, and then the FRGs were matched to carry out difference analysis and risk model construction, respectively. TCGA data set was used as the main body and GEO data was used to verify the model with good grouping, and FRG related to the prognosis of BRCA patients were obtained. Then, GO, KEGG and GSEA analyses were performed with multiple databases to obtain the functions related to FRG. Last, the immune cells and function were analyzed
Fig. 2
Fig. 2
FRGs' expressions and interactions. a Heatmap (green: low expression level; red: high expression level) of the genes participating in autophagy between the normal (N, brilliant blue) and the tumor tissues (T, red). P values were showed as:*P < 0.05; **P < 0.01; ***P < 0.001. b PPI network showing the interactions of the FRGs (interaction score = 0.7). c The correlation network of the genes participating in autophagy (red line: positive correlation; blue line: negative correlation. The depth of the colors reflects the strength of the relevance). d Mutations (The most common types of mutations observed were truncating and missense mutations, with PIK3CA exhibiting the highest mutation rate at 38%)
Fig. 3
Fig. 3
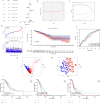
a 1109 BRCA patients were grouped into two clusters according to the consensus clustering matrix (k = 2). b Heatmap. Heatmap and the clinicopathologic characters of the two clusters classified by these DEGs (T, N, and Stage are the degree of tumor differentiation. c Kaplan–Meier OS curves for the two clusters
Fig. 4
Fig. 4
a A Univariate Cox regression analysis of OS for each FRGs, and 6 genes with P < 0.01. b Lasso regression of the 6 OS-related genes. c Cross-validation for tuning the parameter selection in the Lasso regression. d The survival status for each patient (low-risk population: on the left side of the dotted line; high-risk population: on the right side of the dotted line). e Kaplan–Meier curves for the OS of patients in the high- and low-risk groups. f The AUC of the prediction of 1, 2, 3-year survival rate of BRCA. g PCA plot for BRCAs based on the risk score. h t-SNE plot for BRCAs based on the risk score. i Survival analysis of BRCA
Fig. 5
Fig. 5
In the GEO cohort, the risk model was verified. a Survival status. b Kaplan–Meier curve. c The AUC of the survival rate. d PCA plot. e t-SNE plot
Fig. 6
Fig. 6
a Heatmap highlighting the relationships between clinicopathologic characteristics and risk categories (green: low expression; red: high expression) illustrating the relationships between clinicopathologic characteristics and risk groups (*P < 0.05; **P < 0.01; ***P < 0.001). b Nomogram and assessment of the risk model
Fig. 7
Fig. 7
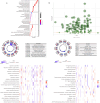
Enrichment analysis for FRGs. a The GO circle illustrates the scatter map of the selected gene's logFC. b The KEGG circle illustrates the scatter map of the logFC of the indicated gene. The greater the Z-score value, the greater the expression of the enriched pathway
Fig. 8
Fig. 8
GSEA analyses. The top six enriched functions or pathways of each cluster were provided to illustrate the distinction between related activities or pathways in various samples. The 'JAK-STAT signaling' was the most enriched
Fig. 9
Fig. 9
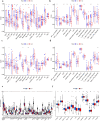
The ssGSEA scores are compared. a + b Comparison of the enrichment scores of 16 kinds of immune cells and 13 immune-related pathways in the TCGA cohort between the low-risk (green box) and high-risk (red box) groups. c + d In the GEO cohort, tumor immunity was compared between the low-risk (blue box) and high-risk (red box) groups. P values were shown as follows: ns not significant. e Expression of immune checkpoints. f The expression of m6a-related genes
Fig. 10
Fig. 10
a Gene regulatory networks of FRGs. b Correlation analysis between the expression of genes (TP63, ACTL8, VGF, and CPLX2) in prognostic signatures and drug sensitivity
Fig. 11
Fig. 11
The CIBERSORT scores are validated
Fig. 12
Fig. 12
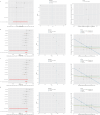
Mendelian randomization analysis. a ACTL8. b IL33. c TP63. d CPLX2

Similar articles

References

    1. Shen M, Pan H, Chen Y, Xu YH, Yang W, Wu Z. A review of current progress in triple-negative breast cancer therapy. Open Med (Wars). 2020;15(1):1143–9. - PMC - PubMed
    1. Harbeck N, Penault-Llorca F, Cortes J, Gnant M, Houssami N, Poortmans P, Ruddy K, Tsang J, Cardoso F. Breast cancer. Nat Rev Dis Primers. 2019;5(1):66. - PubMed
    1. Wilkinson AN. Demystifying breast cancer. Can Fam Physician. 2023;69(7):473–6. - PMC - PubMed
    1. Loibl S, Poortmans P, Morrow M, Denkert C, Curigliano G. Breast cancer. Lancet. 2021;397(10286):1750–69. - PubMed
    1. Pesapane F, Nicosia L, Cassano E. Updates on breast cancer. Cancers (Basel). 2023;15(22):5392. - PMC - PubMed

LinkOut - more resources