. 2025 May 5;24(1):134.
doi: 10.1186/s12943-025-02320-y.

The anti-diabetic PPARγ agonist Pioglitazone inhibits cell proliferation and induces metabolic reprogramming in prostate cancer

Affiliations

The anti-diabetic PPARγ agonist Pioglitazone inhibits cell proliferation and induces metabolic reprogramming in prostate cancer

Emine Atas et al. Mol Cancer. .

Abstract

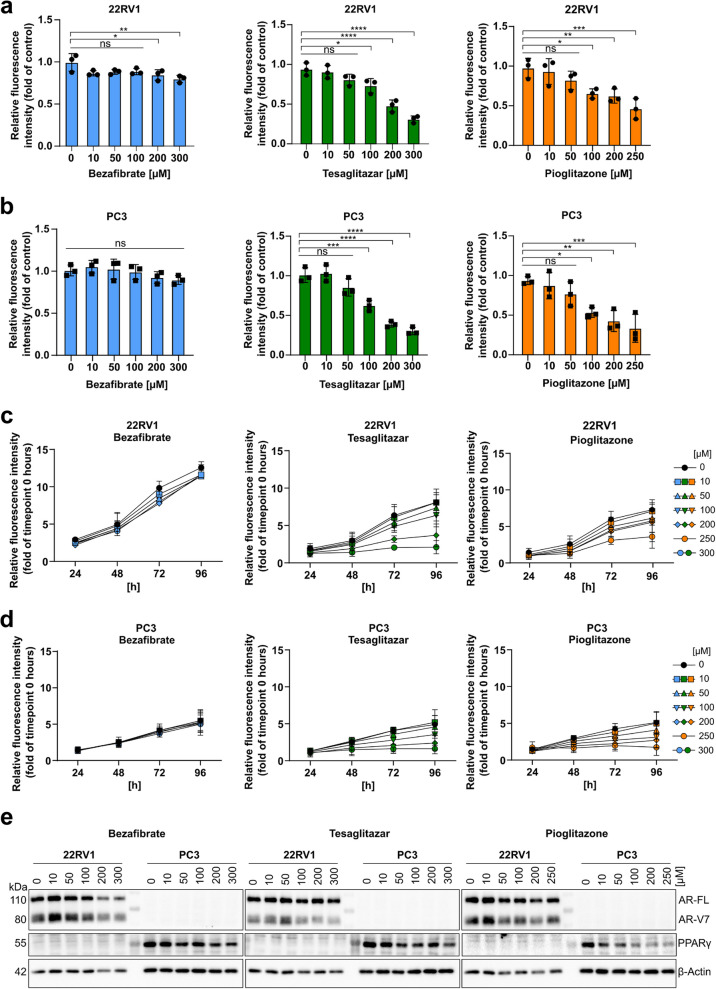
Prostate cancer (PCa) and Type 2 diabetes (T2D) often co-occur, yet their relationship remains elusive. While some studies suggest that T2D lowers PCa risk, others report conflicting data. This study investigates the effects of peroxisome proliferator-activated receptor (PPAR) agonists Bezafibrate, Tesaglitazar, and Pioglitazone on PCa tumorigenesis. Analysis of patient datasets revealed that high PPARG expression correlates with advanced PCa and poor survival. The PPARγ agonists Pioglitazone and Tesaglitazar notably reduced cell proliferation and PPARγ protein levels in primary and metastatic PCa-derived cells. Proteomic analysis identified intrinsic differences in mTORC1 and mitochondrial fatty acid oxidation (FAO) pathways between primary and metastatic PCa cells, which were further disrupted by Tesaglitazar and Pioglitazone. Moreover, metabolomics, Seahorse Assay-based metabolic profiling, and radiotracer uptake assays revealed that Pioglitazone shifted primary PCa cells' metabolism towards glycolysis and increased FAO in metastatic cells, reducing mitochondrial ATP production. Furthermore, Pioglitazone suppressed cell migration in primary and metastatic PCa cells and induced the epithelial marker E-Cadherin in primary PCa cells. In vivo, Pioglitazone reduced tumor growth in a metastatic PC3 xenograft model, increased phosho AMPKα and decreased phospho mTOR levels. In addition, diabetic PCa patients treated with PPAR agonists post-radical prostatectomy implied no biochemical recurrence over five to ten years compared to non-diabetic PCa patients. Our findings suggest that Pioglitazone reduces PCa cell proliferation and induces metabolic and epithelial changes, highlighting the potential of repurposing metabolic drugs for PCa therapy.

Keywords: Cancer therapy; Energy metabolism; Extracellular acidification; Metabolic rewiring; Oxygen consumption rate; PPAR agonists; Type 2 diabetes mellitus (T2DM).


Conflict of interest statement

Declarations. Ethical Approval and consent to participate: The retrospective data analysis was approved by the local ethics committee of Medical University Innsbruck (Vote number: 1301/2023) and performed according to the Declaration of Helsinki. The patient's consent for the use of residual material was obtained. All animal procedures were carried out under UK Home Office license PP0918061 according to the Animals (Scientific Procedures) Act 1986 and were approved by the University of Cambridge Animal Welfare and Ethical Review Board (AWERB). Consent for publication: Not applicable. Competing interests: The authors declare no competing interests.

Figures

Fig. 1
Fig. 1
PCa patients with high PPARG expression have reduced survival probabilities. a Normalized mRNA expression of PPARA (left), PPARD (middle), and PPARG (right) based on bulk RNA-sequencing data from the Prostate Cancer Atlas comprising healthy (n = 173), primary PCa (n = 708) and ARPC patients (n = 428). Significance was tested via one-way ANOVA (ns = not significant p > 0.05, * p ≤ 0.05, ** p ≤ 0.01, *** p ≤ 0.001, **** p ≤ 0.0001). b Kaplan-Meier analysis showing BCR-free survival for primary PCa patients (n = 333) from the TCGA-PRAD cohort comparing high versus low expression of PPARA (left), PPARD (middle), and PPARG (right). Significance was determined using Cox regression analysis (p ≤ 0.05). c QRT-PCR analysis of basal mRNA levels of PPARG relative to β-Actin in indicated PCa cell lines. Data are representative of the means ± standard deviations (SD) of biological triplicates. d Western Blot analysis of androgen receptor full-length (AR-FL) and the splice variant 7 (AR-V7), as well as PPARγ in different PCa cell lines. Β-Actin was used as a loading control
Fig. 2
Fig. 2
PPAR agonists inhibit cell proliferation in primary 22RV1 and metastatic PC3 cells. a, b Relative fluorescence intensities normalized to vehicle control (0.2 % DMSO) of resazurin-based metabolic activity assay of 22RV1 (a) and PC3 cells (b) treated with serial dilutions of the PPAR agonists Bezafibrate, Tesaglitazar, and Pioglitazone for 72 hours. Significance was determined by one-way ANOVA (ns = not significant p > 0.05, * p ≤ 0.05, ** p ≤ 0.01, *** p ≤ 0.001, **** p ≤ 0.0001). c, d Relative fluorescence intensities normalized to time point 0 hours of resazurin-based metabolic activity assay of 22RV1 (c) and PC3 cells (d) following treatment with PPAR agonists or control (0.2 % DMSO) at indicated concentrations (highest concentration for Pioglitazone was 250 µM) in time-course experiments (24, 48, 72, and 96 hours). Data of resazurin assays are representative of the means ± SD of biological triplicates. e Western blot showing AR-FL, AR-V7, and PPARγ protein levels after 24 hours of treatment with increasing concentrations of Bezafibrate (left), Tesaglitazar (middle), and Pioglitazone (right). Β-Actin was used as a loading control. Representative western blots of biological triplicates are shown
Fig. 3
Fig. 3
Proteome analysis reveals altered metabolic pathways in primary 22RV1 and metastatic PC3 cells. a Workflow of sample preparation and comparative proteome analysis of 22RV1 and PC3 cells (”Cell type”) under basal conditions or following treatment with PPAR agonists (24 hours, 100 µM, vehicle control = 0.2 % DMSO) as indicated. b Qualitative Venn diagram showing unique (“only”) and common protein identities in 22RV1 (orange) and PC3 (blue) cells under basal (untreated) conditions. c, d MSig database enrichment analysis for pathways of proteins that were detected in both cell lines (c) and in 22RV1 or PC3 cells only (d). e Volcano plot showing differences in protein expression levels (log2 fold change) among 22RV1 and PC3 cells under basal culture conditions with -log10 p-values (colored dots indicate proteins with a log2 fold change = ≤ -1|≥ 1 and -log10 p ≥ 1.3 assessed by unpaired Welch´s T-test with BJH correction (FDR = 0.05)). f GSEA analysis of significantly deregulated pathways (nested enrichment score (NES) = ≤ -1|≥ 1, p ≤ 0.05) comparing 22RV1 with PC3 cells under basal conditions is based on the Wikipathways and HALLMARKS database
Fig. 4
Fig. 4
PPAR agonists alter the expression of proteins involved in metabolic pathways in primary 22RV1 and metastatic PC3 cells. a, b Qualitative Venn diagrams of proteins detected in 22RV1 (a) or PC3 cells (b) and after 24 hours of treatment with the PPAR agonists Bezafibrate, Tesaglitazar, and Pioglitazone (100 µM, vehicle control = 0.2 % DMSO). c, d Volcano plots of DEP comparing control samples of 22RV1 (c) or PC3 (d) with each PPAR agonist. e Venn diagrams of proteins that were commonly up - or downregulated by all PPAR agonists in 22RV1 or PC3 cells (log2 fold change = ≤ -1|≥ 1 and -log10 p ≥ 1.3). Significance was assessed by an unpaired Welch´s T-test with BJH correction (FDR = 0.05). f GSEA analysis of significantly deregulated pathways (nested enrichment score (NES) = ≤ - 1|≥ 1, p ≤ 0.05) in 22RV1 and PC3 cells after treatment with each PPAR agonist compared to the control sample based on the HALLMARKS database
Fig. 5
Fig. 5
PPARγ agonist Pioglitazone reprograms primary and metastatic PCa cell metabolism and induces an epithelial phenotype in 22RV1 cells. a Workflow scheme for metabolic assessment based on the Seahorse assay, NRM untargeted metabolomics, and radiotracer cell uptake of 22RV1 and PC3 cells upon PPAR agonist Bezafibrate, Tesaglitazar, and Pioglitazone treatment (24 hours, 100 µM, vehicle control = 0.2 % DMSO). b Metabolic profile of 22RV1 and PC3 cells comparing basal oxygen consumption rate (OCR) and extracellular acidification rate (ECAR) calculated from fourth basal timepoint before Oligomycin injection. c, d, e Mitochondrial stress-induced OCR (c), ATP production (d) and ECAR in 22RV1 cells under control culture conditions and PPAR agonist treatment (e). Oligomycin was used as an inhibitor of ATP synthase/complex V, FCCP for maximal respiration by chemical uncoupling of the mitochondrial membrane gradient, and Rotenone Antimycin A (R/A) for non-mitochondrial respiration by complex I and III inhibition. f, g, h Mitochondrial stress-induced OCR responses (f), ATP production (g), and ECAR in PC3 cells (h) as described for 22RV1 cells. i, j, k Glycolysis test in 22RV1 after glucose and pyruvate starvation and treatment of PPAR agonists, as described above. Glucose injection after starvation serves as a measure for glycolysis, Oligomycin as the remaining contribution of OXPHOS to cellular energy production, and 2-deoxy-glucose (2-DG) for non-glycolytic ECAR contribution. ECAR profiles upon glucose injection following 75 minutes of glucose and pyruvate starvation (i), normalized glycolysis of 22RV1 cells treated with PPAR agonists (j), and normalized OCR (k). l, m, n Glycolysis tests in PC3 cells as described for 22RV1 cells (i, j, k). o Score plot of partial least squares-discriminant analysis (PLS-DA) model for bucketed NMR spectral data from 22RV1 (left; the model parameters for the two components fitted were as follows: R2Y = 0.498, Q2Y = 0.301) and PC3 cell extracts (right; the model parameters for the three components fitted were as follows: R2Y = 0.696, Q2Y = 0.499) treated with PPAR agonists as described above. p Relative abundance of short-chain fatty acids, resulting from the untargeted metabolomics of PPAR agonist treated 22RV1 (left) and PC3 cells. q [18F]FTHA uptake after 24 hours of treatment with each PPAR agonist in 22RV1 and PC3 cells. r Western Blot analysis of mTOR, phospho mTOR (Ser2448), AMPKα, phospho AMPKα (Thr172), E-Cadherin, and Vimentin expression in control and PPAR agonist treated 22RV1 and PC3 cells, β-Actin was used as a loading control. One representative experiment of the Seahorse assay profile is shown. Significance was evaluated by one-way ANOVA (ns = not significant p > 0.05, * p ≤ 0.05, ** p ≤ 0.01, *** p ≤ 0.001, **** p ≤ 0.0001). Data are representative of the means ± SD biological triplicates
Fig. 5
Fig. 5
PPARγ agonist Pioglitazone reprograms primary and metastatic PCa cell metabolism and induces an epithelial phenotype in 22RV1 cells. a Workflow scheme for metabolic assessment based on the Seahorse assay, NRM untargeted metabolomics, and radiotracer cell uptake of 22RV1 and PC3 cells upon PPAR agonist Bezafibrate, Tesaglitazar, and Pioglitazone treatment (24 hours, 100 µM, vehicle control = 0.2 % DMSO). b Metabolic profile of 22RV1 and PC3 cells comparing basal oxygen consumption rate (OCR) and extracellular acidification rate (ECAR) calculated from fourth basal timepoint before Oligomycin injection. c, d, e Mitochondrial stress-induced OCR (c), ATP production (d) and ECAR in 22RV1 cells under control culture conditions and PPAR agonist treatment (e). Oligomycin was used as an inhibitor of ATP synthase/complex V, FCCP for maximal respiration by chemical uncoupling of the mitochondrial membrane gradient, and Rotenone Antimycin A (R/A) for non-mitochondrial respiration by complex I and III inhibition. f, g, h Mitochondrial stress-induced OCR responses (f), ATP production (g), and ECAR in PC3 cells (h) as described for 22RV1 cells. i, j, k Glycolysis test in 22RV1 after glucose and pyruvate starvation and treatment of PPAR agonists, as described above. Glucose injection after starvation serves as a measure for glycolysis, Oligomycin as the remaining contribution of OXPHOS to cellular energy production, and 2-deoxy-glucose (2-DG) for non-glycolytic ECAR contribution. ECAR profiles upon glucose injection following 75 minutes of glucose and pyruvate starvation (i), normalized glycolysis of 22RV1 cells treated with PPAR agonists (j), and normalized OCR (k). l, m, n Glycolysis tests in PC3 cells as described for 22RV1 cells (i, j, k). o Score plot of partial least squares-discriminant analysis (PLS-DA) model for bucketed NMR spectral data from 22RV1 (left; the model parameters for the two components fitted were as follows: R2Y = 0.498, Q2Y = 0.301) and PC3 cell extracts (right; the model parameters for the three components fitted were as follows: R2Y = 0.696, Q2Y = 0.499) treated with PPAR agonists as described above. p Relative abundance of short-chain fatty acids, resulting from the untargeted metabolomics of PPAR agonist treated 22RV1 (left) and PC3 cells. q [18F]FTHA uptake after 24 hours of treatment with each PPAR agonist in 22RV1 and PC3 cells. r Western Blot analysis of mTOR, phospho mTOR (Ser2448), AMPKα, phospho AMPKα (Thr172), E-Cadherin, and Vimentin expression in control and PPAR agonist treated 22RV1 and PC3 cells, β-Actin was used as a loading control. One representative experiment of the Seahorse assay profile is shown. Significance was evaluated by one-way ANOVA (ns = not significant p > 0.05, * p ≤ 0.05, ** p ≤ 0.01, *** p ≤ 0.001, **** p ≤ 0.0001). Data are representative of the means ± SD biological triplicates
Fig. 6
Fig. 6
Pioglitazone suppresses cell migration of PCa cells and growth of metastatic PC3 xenograft tumors. a Relative wound density resulting from scratch wound assay of 22RV1 (left) and PC3 (right) cells for 24 hours treatment with each PPAR agonist (100 µM, vehicle control = 0.2 % DMSO). One-way ANOVA was used to test for significance (ns = not significant p > 0.05, * p ≤ 0.05, ** p ≤ 0.01, *** p ≤ 0.001, **** p ≤ 0.0001). Data represent the means ± SD of biological triplicates. b Workflow scheme of the mouse xenograft experiment of PC3 cells in male NSG mice. c Tumor volume throughout the 14 days of treatment with Tesaglitazar (0.4 mg/kg) and Pioglitazone (10 mg/kg) or vehicle control (20 % hydroxypropyl-beta cyclodextrin) (n = 6). Significance was evaluated by two-way ANOVA (ns = not significant p > 0.05, * p ≤ 0.05, ** p ≤ 0.01, *** p ≤ 0.001, **** p ≤ 0.0001). d Representative images of immunohistochemistry (IHC) evaluation of Ki67, CC3, phospho AMPKα, and phospho mTOR in xenograft tumors after treatment with Tesaglitazar, Pioglitazone or vehicle control (20x magnification, scale bar = 50 µm). e IHC quantifications of phospho AMPKα, and phospho mTOR of Tesaglitazar and Pioglitazone treated xenograft tumors (n = 4). Significance was evaluated by one-way ANOVA (ns = not significant p > 0.05, * p ≤ 0.05, ** p ≤ 0.01, *** p ≤ 0.001, **** p ≤ 0.0001). f, g Kaplan-Meier analysis showing BCR-free survival of age-matched non-diabetic (n = 20) and diabetic PCa patients (n = 47) (f), as well as diabetic patients treated with SGLT2 inhibitors (n = 15), Metformin (n = 17), PPAR agonists (n = 3), Insulin (n = 4) and DDP4 plus Metformin (n = 14) (g). Log-rank (Mantel-Cox) test was used to test for significance (p ≤ 0.05)

References

    1. Siegel RL, Miller KD, Wagle NS, Jemal A. Cancer statistics, 2023. CA Cancer J Clin. 2023;73:17–48. - PubMed
    1. Jacob A, Raj R, Allison DB, Myint ZW. Androgen Receptor Signaling in Prostate Cancer and Therapeutic Strategies. Cancers. 2021;13:5417. - PMC - PubMed
    1. Feng, Q. & He, B. Androgen Receptor Signaling in the Development of Castration-Resistant Prostate Cancer. Front. Oncol. 9, (2019). - PMC - PubMed
    1. Zhang H, et al. Androgen Metabolism and Response in Prostate Cancer Anti-Androgen Therapy Resistance. Int J Mol Sci. 2022;23:13521. - PMC - PubMed
    1. Sekhoacha M, et al. Prostate Cancer Review: Genetics, Diagnosis, Treatment Options, and Alternative Approaches. Molecules. 2022;27:5730. - PMC - PubMed

LinkOut - more resources