. 2025 Jul;344(5):266-283.
doi: 10.1002/jez.b.23293. Epub 2025 May 4.

CRISPR/Cas9 Knockout of Shell Matrix Protein 1 in the Slipper-Snail Crepidula atrasolea

Affiliations

CRISPR/Cas9 Knockout of Shell Matrix Protein 1 in the Slipper-Snail Crepidula atrasolea

Grant Batzel et al. J Exp Zool B Mol Dev Evol. 2025 Jul.

Abstract

Over the course of hundreds of millions of years, biomineralization has evolved independently many times across all kingdoms of life. Among animals, the phylum Mollusca displays a remarkable diversity in biomineral structures, particularly the molluscan shell, which varies greatly in shape, size, pigmentation, and patterning. Shell matrix proteins (SMPs) are key components of these shells, and are thought to drive the precipitation of calcium carbonate minerals and influence shell morphology. However, this structure-function relationship has rarely been studied directly because tools for knocking out genes did not exist in molluscs until recently. In this study, we report the first successful use of CRISPR/Cas9 gene editing to target an SMP in gastropod molluscs. Using the emerging model gastropod Crepidula atrasolea, we generated knockouts of the SMP1 gene. Successful gene editing was confirmed by Sanger and MiSeq sequencing, and loss of SMP1 expression was validated through high-content imaging of crispant embryos. This study establishes C. atrasolea as a valuable model for investigating the genetic basis of shell formation and provides a framework for applying CRISPR/Cas9 technology in other molluscan species. Our approach will enable future studies to thoroughly test the role of SMPs in shaping the diverse array of molluscan shell structures.

Keywords: CRISPR/Cas9; SMP1; Spiralia; mollusca; shell gland; shell matrix protein.


Conflict of interest statement

The authors declare no conflicts of interest.

Figures

Figure 1
Figure 1
Crepidula atrasolea as a molluscan model for studying the function of shell matrix proteins. (A) Current molluscan consensus phylogeny highlighting the major gastropod species amenable to genetic perturbation techniques. Green circles indicate studies in which reagent delivery (microinjection or electroporation) and gene perturbation techniques have been reported in each species or respective molluscan class. Open circles denote the same features that have not been found by the authors in the literature as of this article's date of publication. (B) Shell development in C. atrasolea. Above: Cartoon depicting larval shell development. The shell gland (sg) is formed approximately 4 days post fertilization (dpf), undergoes evagination to form the shell field (sf) between 5 and 6 dpf, with the earliest appearance of the mineralized larval shell (purple) visible between 6 and 7 dpf. Below: Maximum intensity projections of right lateral embryos depicting nuclei (Hoescht) and SMP1 (pink) mRNA expression during larval shell development. SMP1 is first detected during late ovoid stage (5 dpf) and persists through hooked stage (7 dpf). (C) Gastropod phylogeny and multiple sequence alignment of SMP1 gastropod proteins identified using orthology inference (Lopez‐Anido et al. 2024). Colored boxes above the alignment depict the major domains found in SMP1 sequences shown in the alignment below. Signal peptide (brown) Reeler domain (red) and low complexity region (orange). Gray boxes below represent different amino acid residue conservation at various residue positions throughout the alignment. Scale bar: 200 μm. Species: BsSMP1, Berghia stephanieae; CaSMP1, Crepidula atrasolea Shell Matrix Protein 1; CfSMP1, Crepidula fornicata; CnSMP1, Cepaea nemoralis; EcSMP1, Elysia chlorotica; FaSMP1, Favorinus auritulus; To, Tritia obsoleta.
Figure 2
Figure 2
Optimization of methods for CRISPR‐Cas9 gene editing in Crepidula atrasolea. (A) Gene and mRNA structure of SMP1. Top schematic depicting SMP1 genomic contig with exons (boxes) and introns (line). Exons are numbered from 1 to 6. Bottom schematic represents SMP1 mRNA including 5′UTR region and coding sequence. Purple triangles denote location of guide RNAs, while green triangles indicate location of primers used for genomic amplification of SMP1. Filled circle denotes the start codon, while the unfilled circle represents the location of the stop codon. (B) Line plot (black lines) and percent error (dark gray shading) depicting survival over time for decapsulated embryos grown in different culturing conditions. Markers indicate culturing conditions used to raise decapsulated embryos. (C) PCR results for amplification of SMP1 on four different gDNA isolation methods. Quantity and quality of gDNA template was assessed using a Nanodrop spectrophotometer and reported are averages for 2–3 replicates of each respective method. Asterisk denotes the NEB method used for all subsequent experiments. (D) In‐vitro cleavage assay of SMP1 circular plasmid with sgRNA 485 and controls. (E) In‐vitro cleavage assay of SMP1 circular plasmid with sgRNA 549 and controls. (F) Toxicity of RNP reagents showing percent survival in late‐ovoid staged embryos approximately 5 dpf using either BSA or Gelatin coated dishes. (G) Max projections of right lateral embryos injected with individual RNP components from (F). Scale bar: 200 μm.
Figure 3
Figure 3
Genotype validation for SMP1 CRISPR/Cas9 knockout using Sanger and MiSeq sequencing in Crepidula atrasolea. (A) Agarose gel showing amplification of SMP1 gene locus (114 F/627 R primers) using template gDNA extracted from either single‐guide+cas9 injected or uninjected embryos. Embryo gDNA was extracted from five pooled embryos using the NEB protocol following a five day embryo incubation period in BSA dishes at 27°C. (B) Inference of CRISPR Edits (ICE) analysis on single guide injected and uninjected Sanger traces. Discordance plots (top and bottom) showing Sanger sequencing traces for SMP1 (green) and wildtype (WT) uninjected control (blue). X‐axis shows base position along the sequencing trace region, while Y‐axis shows nucleotide disagreement between SMP1 and wildtype traces. Greatest discordance occurs at the location of the guide (dotted line). Top: Discordance plot for g485 injected and uninjected amplicons. Bottom: Discordance plot for g549 injected and uninjected amplicons. (C) ICE analysis on dual‐guide injected and uninjected Sanger traces conducted in parallel using the same uninjected control. Top: SMP1 Discordance plot for g485 and g549 injected (green) and uninjected (blue) Sanger traces. Bottom: SMP1 locus amplification using Brachyury specific guides (orange) and uninjected (blue) Sanger traces. No discordance between traces was observed. (D) 2% Agarose gel of amplified SMP1 locus in embryos injected with g485 + 549 + cas9 or uninjected WT control. (E) Editing frequency using 2 × 250 bp MiSeq sequencing on amplicon samples from (D) showing percentage of modified or unmodified alleles. (F) Bar plots showing indel frequency of alleles in two samples of single‐embryo DNA extractions: SMP1 crispant (top) or uninjected wildtype embryos (bottom). Red bars indicate no indels detected in alleles; blue bars denote the percentage of alleles with indels. (G) Allele‐specific editing outcomes for SMP1 crispants. Top: g485 centered region with percentage of reads on the right. Bottom: g549 centered region with percentage of reads on the right. Dotted line (blue) denotes predicted cleavage position 3 bp upstream of the PAM site. Purple bars indicate the position of the guide along the reference sequence.
Figure 4
Figure 4
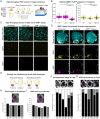
Methods for phenotypic validation of SMP knockout using high‐throughput HCR and WGA shell staining. (A) Schematic depicting the experimental setup for validating mRNA expression in crispant embryos. One‐cell‐stage zygotes were injected with SMP1 gRNA and cas9 and raised to shell gland stages. Embryos underwent hybridization chain reaction (HCR) using probes specific for SMP1 (pink) and SMP3 (yellow), and their fluorescence values were compared to control embryos (uninjected, cas9 only, and no probes not shown in schematic). (B) Box plots showing the embryo max fluorescence intensity for SMP1 (pink) and SMP3 (yellow) channels; dots indicate values for individual embryos in a treatment. Reduction on average fluorescence intensity for SMP1 was observed in crispants compared to cas9 and uninjected treatments. (C) Max intensity projections from high‐content imaging of HCR stained embryos (4–6 dfp) that were either injected with gRNA with Cas9, cas9 only, or were uninjected. Top row shows all three channels (DAPI, cyan; SMP3, yellow; SMP1, magenta) merged, while bottom two rows are individual channels for SMP3 and SMP1, respectively. Scale bar: 1 mm (D) Max intensity projections of HCR stained embryos at early‐hooked stage (6 dpf). Top row shows merged channels (DAPI, SMP3, SMP1), bottom rows are isolated channels with gray dashes outlining the embryo from the top row. Scale bar: 150 µm (E) Schematic of the experimental setup for assaying shell phenotypes of crispant embryos. One‐cell‐stage zygotes were injected with SMP1 gRNAs and cas9, and stained with WGA at the hooked stage (7 dpf). Embryos were assessed for presence or absence of WGA signal in the shell. Shell length and shell area were measured for crispant and uninjected embryos. (F) Stacked barplot of percentage of crispant and wildtype embryo stages at 6 dpf. (G) Stacked barplot of percentage of crispant and wildtype embryos that have WGA staining in the shell. (H) Barplot showing average shell length for crispant (grey) and uninjected (black) embryos. (I) Barplot of the average shell area in crispant and wildtype embryos.

References

    1. Adema, C. M. 2021. “Sticky Problems: Extraction of Nucleic Acids From Molluscs.” Philosophical Transactions of the Royal Society, B: Biological Sciences 376: 20200162. - PMC - PubMed
    1. Aguilera, F. , McDougall C., and Degnan B. M.. 2017. “Co‐Option and De Novo Gene Evolution Underlie Molluscan Shell Diversity.” Molecular Biology and Evolution 34: msw294. - PMC - PubMed
    1. Barbera, P. , Kozlov A. M., Czech L., et al. 2019. “EPA‐ng: Massively Parallel Evolutionary Placement of Genetic Sequences.” Systematic Biology 68: 365–369. - PMC - PubMed
    1. Barone, V. , and Lyons D. C.. 2022. “Live Imaging of Echinoderm Embryos to Illuminate Evo‐Devo.” Frontiers in Cell and Developmental Biology 10: 1007775. - PMC - PubMed
    1. Barqué, A. , Jan K., De La Fuente E., Nicholas C. L., Hynes R. O., and Naba A.. 2021. “Knockout of the Gene Encoding the Extracellular Matrix Protein SNED1 Results in Early Neonatal Lethality and Craniofacial Malformations.” Developmental Dynamics 250: 274–294. - PMC - PubMed

LinkOut - more resources