. 2025 Jun 4;19(6):jjaf076.
doi: 10.1093/ecco-jcc/jjaf076.

Differential effects of tofacitinib on macrophage activation contribute to lack of response in ulcerative colitis patients

Affiliations

Differential effects of tofacitinib on macrophage activation contribute to lack of response in ulcerative colitis patients

Elisa Melón-Ardanaz et al. J Crohns Colitis. .

Abstract

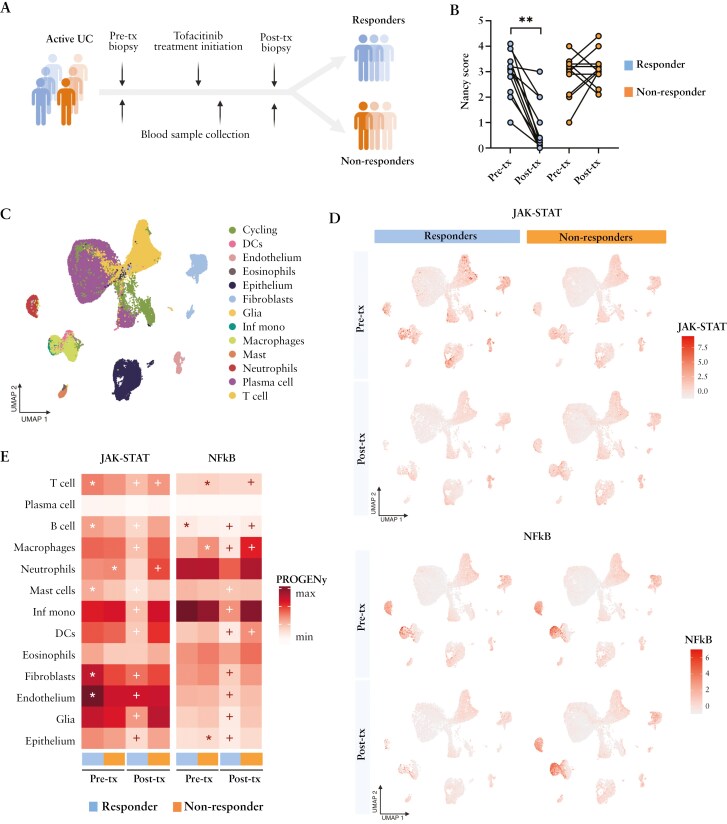
Background and aims: Tofacitinib, a Janus kinase inhibitor, is approved for the treatment of moderate-to-severe ulcerative colitis. Nonetheless, 40-60% of patients will not respond adequately. The mechanisms underlying responses to tofacitinib remain unknown.

Methods: We applied single-cell and/or bulk RNA analysis to biopsies (n = 23 and 63, respectively) from ulcerative colitis patients (n = 31) before and after tofacitinib treatment. Response was assessed using endoscopic and clinical criteria. In vitro-derived macrophages and primary intestinal fibroblasts were used to validate our findings.

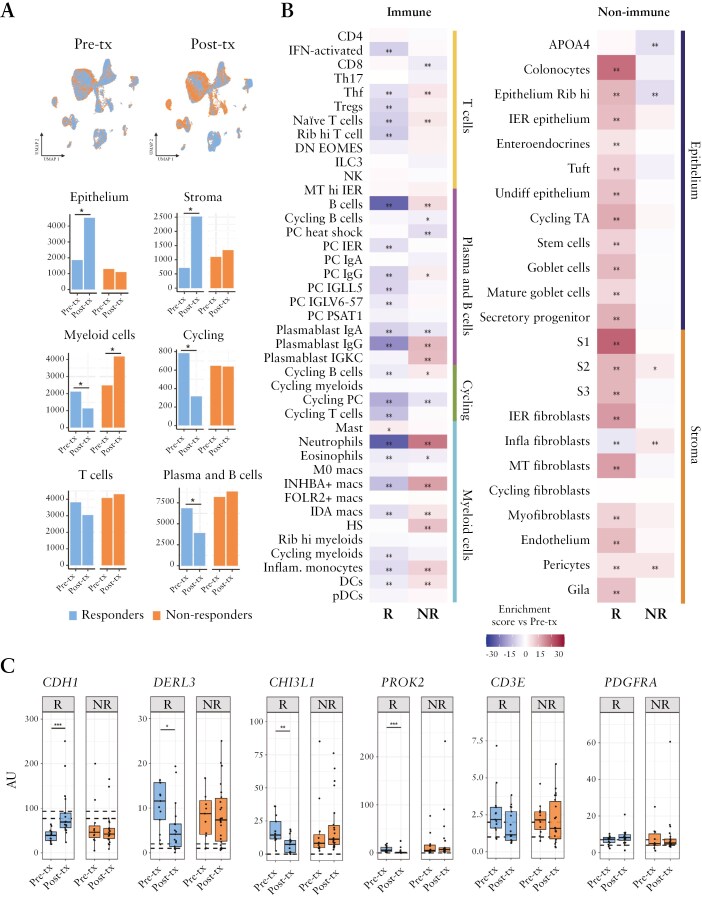
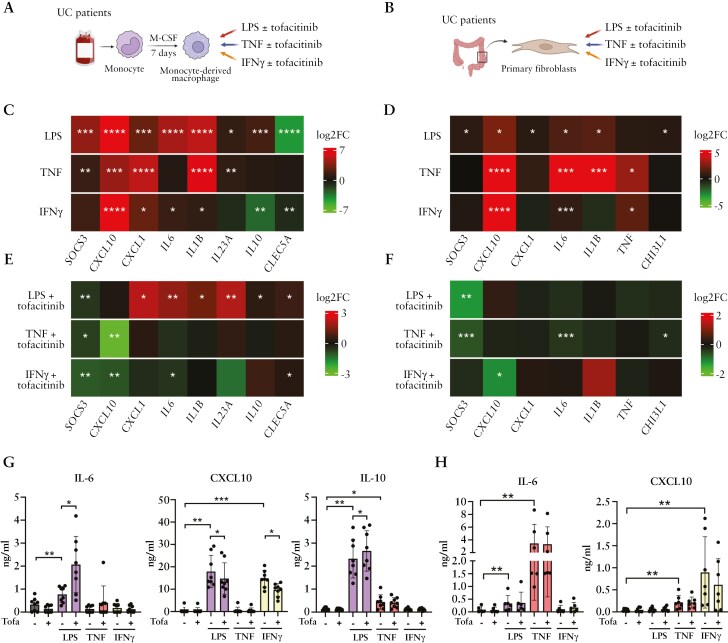
Results: Forty percent of patients responded to tofacitinib. Responders exhibited higher baseline JAK-STAT activity, while non-responders had increased baseline NF-kB pathway activation. Response was associated with significant changes in the abundance and/or activation of immune, epithelial, and stromal cells and the downregulation of S100A9, FCGR3A, MMP12 in resident macrophages. In contrast, non-responders showed a significant increase in the number and activation of macrophages and fibroblasts following tofacitinib treatment, including upregulation of MMP9, IL1B, IL6, CXCL1, CXCL8, and S100A9 compared to baseline. In monocyte-derived macrophages tofacitinib drove the hyperactivation of macrophages in response to lipopolysaccharide, but not TNF or IFNγ. This effect is dependent on the inhibition of IL-10 signaling, which is abundantly induced in response to LPS, but not to TNF or IFNγ. In contrast, cultured fibroblasts, which produced no IL-10 regardless of the stimuli, showed no hyperactivation when pre-treated with tofacitinib.

Conclusions: We conclude that resistance to tofacitinib is mediated by the hyperactivation of myeloid cells and we identify IL-10-dependent macrophages as one cellular subset contributing to this resistance.

Keywords: macrophage; single-cell RNA sequencing; tofacitinib.


Conflict of interest statement

IO has served as speaker and/or consultant and has received educational funding from Abbvie, Pfizer, Takeda, Janssen, Kern Pharma, and Faes Farma, and has received research funding from Abbvie and Faes Farma. AF-C has served as a speaker or has received educational funding from Pfizer, Janssen, Takeda, Dr. Falk, and Chiesi. BV reports research support from AbbVie, Biora Therapeutics, Landos, Pfizer, Sossei Heptares and Takeda; speaker’s fees from Abbvie, Biogen, Bristol Myers Squibb, Celltrion, Chiesi, Falk, Ferring, Galapagos, Janssen, Lily, MSD, Pfizer, R-Biopharm, Sandoz, Takeda, Tillots Pharma, Truvion and Viatris; and consultancy fees from Abbvie, Alfasigma, Alimentiv, Applied Strategic, Astrazeneca, Atheneum, BenevolentAI, Biora Therapeutics, Boxer Capital, Bristol Myers Squibb, Galapagos, Guidepont, Landos, Lily, Merck, Mylan, Inotrem, Ipsos, Janssen, Pfizer, Progenity, Sandoz, Sanofi, Santa Ana Bio, Sapphire Therapeutics, Sosei Heptares, Takeda, Tillots Pharma and Viatris. BV owns stock options in Vagustim. SV received grants from AbbVie, Johnson & Johnson, Pfizer, Galapagos, and Takeda; and has received consulting and/or speaking fees from AbbVie, Arena Pharmaceuticals, Avaxia, Boehringer Ingelheim, Celgene, Falk, Ferring, Galapagos, Genentech-Roche, Gilead, Hospira, Janssen, Mundipharma, MSD, Pfizer, Prodigest, Progenity, Prometheus, Robarts Clinical Trials, Second Genome, Shire, Takeda, Theravance, and Tillots Pharma AG. JP received consultancy fees/honorarium from AbbVie, Alimentiv, Athos, Atomwise, Boehringer Ingelheim, Celsius, Ferring, Galapagos, Genentech/Roche, GlaxoSmithKline, Janssen, Mirum, Nimbus, Pfizer, Progenity, Prometheus, Protagonist, Revolo, Sanofi, Sorriso, Surrozen, Takeda, and Wasserman, and has served on data safety monitoring boards for Alimentiv, Mirum, Sorriso, Sanofi, and Surrozen. ER has received educational funds, speaker fees, research support, or consulting fees from MSD, Abbvie, Ferring, Faes Pharma, Janssen, Otsuka, Pfizer, Takeda, Galapagos, Kern Pharma, Lilly, and Fresenius Kabi. AS has received grants from Pfizer, Roche-Genentech, AbbVie, GSK, Scipher Medicine, Alimentiv, Inc, Boehringer Ingelheim, and Agomab; received consulting or talking fees from Genentech, GSK, Pfizer, Galapagos, AdBio Partners, HotSpot Therapeutics, Alimentiv, Nestle, GoodGut and Agomab. The remaining authors disclose no conflicts of interest.

Figures

Graphical Abstract
Graphical Abstract
Figure 1.
Figure 1.
Study design and inferred pathway activity using scRNA-seq. (A) Schematic representation of the study workflow. Biopsies (for single-cell RNA-seq, transcriptional analysis and histological validation) and blood were collected from 31 patients before starting tofacitinib treatment (pre-tx) and during follow-up (post-tx). (B) Nancy histological index in biopsies from responder and non-responder patients before and after tofacitinib treatment. Wilcoxon test for matched data (two-tailed P-value). **P < .01. (C) Uniform manifold approximation and projection (UMAP) of 69,813 intestinal cells color-coded by main cell type. (D) UMAPs showing the PROGENy pathway scores for JAK-STAT and NF-kB separated by condition. (E) Heatmap showing the mean of JAK-STAT and NF-kB pathway scores using PROGENy across all cell types in pre-and post-treatment samples. Wilcoxon signed-rank test adjusted using Bonferroni correction: *P < .05 (R Pre-tx vs NR Pre-tx; * is shown for the group with increased higher mean pathway activation); + P < .05 (Pre-tx vs Post-tx in R and NR).
Figure 2.
Figure 2.
Treatment with tofacitinib induces significant changes in the abundance of intestinal cell types in responder and non-responder patients. (A) UMAPs of pre-treatment (pre-tx; 33,941 cells) and post-treatment (post-tx; 35,872 cells) intestinal cells color-coded by response to tofacitinib. Bar plots depict the cellular abundance of the six major cell types (epithelium, stroma, plasma and B cells, myeloid cells, cycling, and T cells) for responder and non-responder patients before (pre-tx) starting tofacitinib and during follow up (post-tx). Comparison was performed using the Chi square test *P < .05. (B) Intestinal cell abundance is shown as the enrichment scores of immune (T cells, plasma, and B cells, cycling and myeloid cells) and non-immune (epithelium and stroma) sub-clusters in responders and non-responders relative to baseline (pre-tx). Comparisons were performed using the Chi square test *P < .05 and **P < .01. (C) Gene expression analysis in whole-biopsy bulk RNA. Selected genes were markers for the main cell lineages. Data is shown separately for responders (blue) pre-tx (n = 13 samples) and post-tx (n = 17 samples); and for non-responders (orange) pre-tx (n = 11 samples) and post-tx (n = 22 samples). Data is expressed as arbitrary units (AU) and presented as boxplots. Dotted lines show the standard error of the mean of biopsies from healthy controls (n = 10). Wilcoxon test. False discovery rate-corrected P-values: *< .05; **< .01, and ***< .001.
Figure 3.
Figure 3.
Tofacitinib induces significant transcriptional changes in intestinal macrophages and fibroblasts. (A) Uniform manifold approximation and projection (UMAP) of scRNA-seq data for myeloid cells colored by cell subsets (9902 cells) from responders and non-responders before (pre-tx) and after (post-tx) treatment with tofacitinib. (B) Volcano plots showing genes differentially expressed in FOLR2 + macrophages post-tx compared to pre-tx in responder (left panel) and non-responder (right panel) patients. A two-sided Wilcoxon rank sum test was applied. Genes with a false discovery rate adjusted P value < .05, and a fold change (FC) > 1.2 (UPP, dark red) or FC < 0.83 (DWW, dark green) were considered regulated. Additionally, genes with a nominal P-value < .05 are shown in light red (UP) if FC > 1.2 and light green if FC < 0.83. macros, macrophages. (C) Jaccard analyses comparing significantly upregulated (adjusted P.value < .05 & FC > 1.2, UPP) genes in FOLR2 + macrophages post-tx in responder and non-responder patients with canonical markers of M1 or M2 macrophages from Garrido-Trigo et al.(D) UMAP of scRNA-seq data for stromal cells colored by cell subsets (5674 cells) from responders and non-responders before (pre-tx) and after (post-tx) treatment with tofacitinib. (E) Volcano plots showing genes differentially expressed in S1 fibroblasts post-tx compared to pre-tx in responders (left panel) and non-responders (right panel). A two-sided Wilcoxon rank sum test was applied. Genes with a false discovery rate adjusted P value < .05, and a fold change (FC) > 1.2 (UPP, dark red) or FC < 0.83 (DWW, dark green) were considered regulated. Additionally, genes with a nominal P-value < .05 are shown in red (UP) if FC > 1.2 and green if FC < 0.83. (F) Jaccard analyses comparing significantly upregulated (adjusted P.value < .05 & FC > 1.2, UPP) genes in S1 fibroblasts post-tx in responder and non-responder patients with canonical markers of S1 or inflammatory fibroblasts from the study by Garrido-Trigo et al.
Figure 4.
Figure 4.
Differential effects of tofacitinib on in vitro-activated macrophages and fibroblasts from UC patients. Experimental design: M-CSF-monocyte-derived macrophages (A) or intestinal fibroblasts (B) from UC patients were exposed to different inflammatory stimuli (LPS, TNF, or IFNγ) in the presence/absence of tofacitinib. Heatmaps showing mean log2 of fold-change (log2FC) in the expression of selected genes. Changes in response to LPS (10 ng/mL), TNF (20 ng/mL), and IFNγ (5 ng/mL) compared to an unstimulated control are shown for (C) M-CSF-monocyte-derived macrophages and (D) fibroblasts. Changes in gene expression induced by tofacitinib (300 nM) on LPS, TNF, or IFNγ-stimulated M-CSF-monocyte-derived macrophages (E) or fibroblasts (F). n = 8 and n = 7 independent experiments, respectively. One-sample t-test false discovery rate-corrected P-values: *<.05, **<.01, ***<.001, ****<.0001. Concentrations of cytokines in supernatants of M-CSF-monocyte-derived macrophages (G) or fibroblasts (H) from UC patients exposed to the different inflammatory stimuli (LPS, IFNγ, or TNF) in the presence of tofacitinib or DMSO as vehicle control. n = 8 and n = 6 independent experiments, respectively. Data are expressed as median ± range. Paired t-test false discovery rate-corrected P-values: *<.05, **<.01, ***<.001, ****<.0001.
Figure 5.
Figure 5.
Tofacitinib enhances response to LPS by interfering with IL-10 signaling on macrophages. (A) Heatmap showing the mean log2 fold-change (log2FC) in the expression of selected genes in M-CSF-monocyte-derived macrophages stimulated with LPS, TNF, or IFNγ, in the presence or absence of an anti-IL10 antibody. Data represent n = 3 independent experiments. One-sample t-test false discovery rate-corrected P-values: *<.05. (B) Scatter plot of log2FC of genes regulated by anti-IL-10 mAb in LPS-stimulated macrophages (data from Cuevas et al compared to the log2FC of genes regulated in FOLR2 + macrophages (scRNAseq data) from patients non-responsive to tofacitinib. Pearson test, P = 2.344 × 10-5. (C) CellPhoneDB cell communication analysis using baseline data in responder (R) and non-responder (NR) patients. Results are presented as a galluvial plot, where lines connect communicating populations, and colors represent the mean intensity of the interactions. ns, not significant; macros, macrophages. (D) Mean expression of mRNA transcripts for each cell type is shown for IL10RB, IL10RA, and IL10 in pre-treatment inflamed samples from R and NR patients. Comparison was performed using Wilcoxon signed-rank test and adjusted using a Bonferroni correction. Significant differences (P < .05) between responders and non-responders are shown in red. (E) IL-10 signaling scores (CytoSig) are shown for pre-treatment inflamed samples. Heatmap shows relative enrichment of IL-10 signaling scores in R and NR patients. Wilcoxon signed-rank test adjusted using Bonferroni correction was applied to compare R versus NR. * P < .05 ** P < .01, *** P < .001.

References

    1. Garrido-Trigo A, Corraliza AM, Veny M, et al. Macrophage and neutrophil heterogeneity at single-cell spatial resolution in human inflammatory bowel disease. Nat Commun. 2023;14:4506. - PMC - PubMed
    1. Schubert M, Klinger B, Klunemann M, et al. Perturbation-response genes reveal signaling footprints in cancer gene expression. Nat Commun. 2018;9:20. - PMC - PubMed
    1. Mereu E, Lafzi A, Moutinho C, et al. Benchmarking single-cell RNA-sequencing protocols for cell atlas projects. Nat Biotechnol. 2020;38:747–755. - PubMed
    1. Cuevas VD, Simon-Fuentes M, Orta-Zavalza E, et al. The gene signature of activated m-CSF-primed human monocyte-derived macrophages is il-10-dependent. J Innate Immun. 2022;14:243–256. - PMC - PubMed
    1. Love MI, Huber W, Anders S.. Moderated estimation of fold change and dispersion for RNA-seq data with deseq2. Genome Biol. 2014;15:550. - PMC - PubMed

MeSH terms

Grants and funding