. 2025 Jul;14(17):e2404111.
doi: 10.1002/adhm.202404111. Epub 2025 May 5.

Engineering Assembloids to Mimic Graft-Host Skeletal Muscle Interaction

Affiliations

Engineering Assembloids to Mimic Graft-Host Skeletal Muscle Interaction

Lucia Rossi et al. Adv Healthc Mater. 2025 Jul.

Abstract

Skeletal muscle (SkM) tissue engineering aims to generate in vitro 3D products that can be implanted in patients to replace or repair damaged muscles. Having a humanized in vitro model able to mimic the interaction between the innervated recipient and the engineered SkMs at a functional level would greatly help in the evaluation of the graft potential. Here, a 3D in vitro model is developed that allows to investigation of the function, stability, and adaptability of the human neuromuscular (NM) system in response to an engineered SkM construct. To achieve this, decellularized SkMs (dSkM)-based constructs are used as engineered SkM and human neuromuscular organoids (NMOs) as the recipient-like NM system to create graft-host SkM assembloids. We observed the migration of myogenic cells and invasion of neural axons from the NMO to the engineered SkM construct in the assembloids, with the generation of functional neuromuscular junctions (NMJs). Finally, assembloids are able to regenerate following acute damage, with SkM regeneration and functional recovery. Despite being limited by the absence of immunocompetent cells and vasculature, the data showed that the assembloid represents a useful tool to evaluate in vitro the response of the human innervated SkM to a potential tissue-engineered SkM graft.

Keywords: assembloids; muscle regeneration; muscle stem cell; neuromuscular organoids; organoids; skeletal muscle; tissue engineering.


Conflict of interest statement

The authors declare no conflict of interest.

Figures
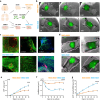
Figure 1
Figure 1
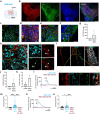
NMOs integrate within dSkMs and rSkMs to form graft‐host SkM assembloids. a) Schematic illustration showing the strategy used for co‐culturing NMOs and dSkMs (NMO‐dSkM, orange) or rSkMs (NMO‐rSkM, light blue). NMOs were derived from hiPSCs upon 22 days (D22 NMO) of NM differentiation. rSkMs were generated upon hMPCs injection within dSkM 7 days (D7 rSkM) before NMOs seeding. Acronyms list: dSkM: decellularized skeletal muscle; hMPCs: human muscle progenitor cells; hiPSCs: human induced pluripotent stem cells; D22 NMO: day 22 neuromuscular organoids; D7 rSkM: day 7 recellularized skeletal muscle construct; NMO‐dSkM: construct obtained from NMO combined with dSkM; NMO‐rSKM: construct obtained from NMO combined with rSkM. b) Representative brightfield (BF) and fluorescence stereomicroscope images showing the progression of GFP‐NMOs at day 1 (D1), day 5 (D5) and day 10 (D10) after seeding onto dSkM (NMO‐dSkM, upper panels) or onto rSkM (NMO‐rSkM, lower panels). Scale bars, 1 mm. c) Upper left and middle panels, representative Z‐stack confocal immunofluorescence images of whole mount NMO‐dSkM after 10 days of co‐culture (D10 NMO‐dSkM) stained for DESMIN (green) and TUJ1 (red). Upper right panel, representative Z‐stack confocal immunofluorescence image of whole mount NMO‐dSkM after 10 days of co‐culture (D10 NMO‐dSkM) stained for DESMIN‐positive cells (green) that invade the dSkM. Nuclei are counterstained with Hoechst (blue). Scale bars, 200 µm. Lower panel, representative Z‐stack confocal immunofluorescence images of whole mount NMO‐rSkM after 10 days of co‐culture (D10 NMO‐rSkM) stained for DESMIN (green) and TUJ1 (red). Right panel, nuclei are counterstained with Hoechst (blue). Scale bars, 500 µm (left), 50 µm (center), 100 µm (right). d) Representative brightfield (BF) and fluorescence stereomicroscope images showing the expansion of GFP‐NMOs after 1 day (D1) and 35 days (D35) from seeding onto dSkM (NMO‐dSKM) or rSkM (NMO‐rSKM). The pink line is used to track the morphological changes of the overall construct shape at the two co‐culture time points. Scale bar, 1 mm. e) NMO area variation (µm2) over culture time (days), expressed as difference between GFP+ area at day n and GFP+ area at day 1 of co‐culture. Data are shown as mean ± SEM of n > 9 independent replicates. Statistical significance determined using Mann‐Whitney U test; ***p = 0.0008 on day 35 (0.99 × 107 ± 0.09 × 107 µm2 versus 0.53 × 107 ± 0.06 × 107 µm2). f) Scaffold area variation (µm2) over culture time (days), expressed as difference between scaffold area at day n and scaffold area at day 1 of co‐culture. Data are shown as mean ± SEM of n>9 independent replicates. Statistical significance determined using Mann‐Whitney U test; ****p < 0.0001 on day 35 (−0.91 × 107 ± 0.07 × 107 µm2 vs −0.25 × 107 ± 0.06 × 107 µm2). g) Ratio between NMO area and scaffold area, expressed in percentage. Data are shown as mean ± SEM of n > 9 independent replicates. Statistical significance determined using Mann‐Whitney U test; ****p < 0.0001 on day 35 (84.02 ± 3.52% vs 34.04 ± 3.92%).
Figure 2
Figure 2
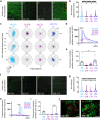
Myogenesis and muscle functionality are improved in NMO‐rSkM assembloids. a) Representative Z‐stack confocal immunofluorescence images of whole mount rSkM (left panel), NMO‐dSkM (center panel) or NMO‐rSkM (right panel) after 35 days (D35) of co‐culture, stained for DESMIN (green). Scale bars, 100 µm. b) Quantification of corrected total fluorescence intensity normalized for background signal performed on DESMIN immunofluorescence staining. Data are shown as mean ± SEM of 36 ROIs per condition (three images per condition, for each image 12 ROIs were selected and quantified). Statistical significance was determined using Mann‐Whitney U test; ****p < 0.0001. Statistical results are reported in Table S1 (Supporting Information). c) Quantification of DESMIN+ myotube cross‐section (thickness) performed on whole mount immunofluorescence images of rSkM, NMO‐dSkM and NMO‐rSkM after 35 days (D35) of culture. Data are shown as mean ± SEM of >100 myotube cross sections, measured on 3 independent samples per condition; statistical significance determined using Mann‐Whitney U test; ****< 0.0001. Statistical results are reported in Table S2 (Supporting Information). d) Representative confocal immunofluorescence image of rSkM, NMO‐dSkM and NMO‐rSkM cross‐sections, stained for PAX7 (red) and MYOG (green). Nuclei are counterstained with Hoechst (blue). Scale bar, 50 µm. e) PAX7 gene expression in rSkMs, NMO‐dSkMs and NMO‐rSkMs. Data are normalized to housekeeping B2‐microglobulin gene expression and shown as fold change over NMO. Data are shown as mean ± s.d. of three independent biological replicates for rSkM and NMO‐dSkM and of six independent biological replicates for NMO‐rSkM. Statistical results are reported in Table S3 (Supporting Information). f) MYOG gene expression in rSkMs, NMO‐dSkMs and NMO‐rSkMs. Data are normalized to housekeeping B2‐microglobulin gene expression and shown as fold change over NMO. Data are shown as mean ± s.d. of three independent biological replicates for rSkM and NMO‐dSkM and of 6 independent biological replicates for NMO‐rSkM. Statistical results are reported in Table S4 (Supporting Information). g) Representative Z‐stack confocal immunofluorescence image NMO‐rSkM cross‐sections at day 35 of co‐culture stained for MYOG (red) and PAX7 (green). Nuclei are counterstained with Hoechst (grey). Scale bars, 50 µm (a). h) Quantification of PAX7+ and PAX7 cells on total cells in untreated samples and expressed in percentage. Data are shown as mean ± s.d. of n>10 images, taken on three independent biological replicates. Statistical significance was determined using Mann‐Whitney U test; ***p = 0.0005. i) Representative Z‐stack confocal immunofluorescence image of NMO‐rSkM cross‐sections at day 35 of co‐culture stained for PAX7 (red) and Ki67 (green). Nuclei are counterstained with Hoechst (blue). Scale bar, 50 µm. j) Quantification of PAX7+Ki67+ and PAX7+Ki67 cells on total PAX7+ cells in untreated samples and expressed in percentage. Data are shown as mean ± SEM of > 10 images, taken on 2 independent biological replicates. k) Representative confocal immunofluorescence image NMO‐rSkM cross‐sections at day 35 of co‐culture showing different localization of PAX7 (red) out (left panel) or under (right panel) basal lamina (LAM, green). Scale bars, 10 µm. Single channels and nuclei staining are reported in Figure S5i (Supporting Information). l) Quantification of PAX7+ localized out or under the basal lamina on total PAX7+ cells in untreated samples and expressed in percentage. Data are shown as mean ± s.d. of n > 10 images, taken on three independent biological replicates. Statistical significance was determined using Mann‐Whitney U test; ****< 0.0001. m) Schematic illustration showing the strategy used to assess muscle compartment functionality in response to exogenous ACh administration. n) Representative quantification of mean normalized fluorescence intensity variation registered during live imaging analysis of D35 rSkM, NMO‐dSkMs and NMO‐rSkMs, stimulated with ACh. Data are shown as mean of 9 ROIs, 3 ROIs were selected from each of 3 independent replicates; measurements with error bars are reported in Figure S6a–c (Supporting Information). Dotted line corresponds to the baseline equal to 0. o) Contraction quantification of rSkM, NMO‐dSkM or NMO‐rSkM at D35 upon exogenous ACh administration expressed as maximum peak of fluorescence revealed via live imaging analysis. Quantifications were performed on 3 independent biological replicates, identified by different symbol shapes in the graph. Each independent sample was divided into 5 ROIs and each point represents a single ROI. Statistical significance was determined using Mann‐Whitney U test; ns, not statistically significant, **p = 0.0066, ***p = 0.0001. Statistical results are reported in Table S5 (Supporting Information). p) MYHC 2A gene expression in NMO‐dSkMs and NMO‐rSkMs. Data are normalized to MYHC gene expression and shown as fold change over NMO‐dSkMs. Data are shown as mean ± s.d. of three independent biological replicates. Statistical significance was determined using unpaired t‐test; ****p < 0.0001.
Figure 3
Figure 3
NMO‐rSkM assembloids possess functional NMJs after 35 days of co‐culture. a) Schematic illustration showing a representation of NMO‐rSkM co‐culture setup. b) Representative Z‐stack confocal immunofluorescence images of whole mount NMO‐rSkMs stained for NEUROFILAMENT (NF, red) and alpha‐SARCOMERIC ACTININ (αSA, green). Nuclei are counterstained with Hoechst (blue). Scale bar, 1 mm. c) Representative Z‐stack confocal immunofluorescence image of NMO‐rSkM cross‐sections stained for TE7 (red) and LAMININ (green). Nuclei are counterstained with Hoechst (blue). Scale bar, 50 µm. d) Representative Z‐stack confocal immunofluorescence image of NMO‐rSkM cross‐sections stained for F‐actin (red) and LAMININ (green). Nuclei are counterstained with Hoechst (blue). Scale bar, 20 µm. e) Representative Z‐stack confocal immunofluorescence image of NMO‐rSkM cross‐sections stained for slow MYOSIN HEAVY CHAIN (MHC, red) and fast MHC (green). Nuclei are counterstained with Hoechst (blue). Scale bar, 50 µm. f) Representative Z‐stack confocal immunofluorescence image of NMO‐rSkM cross‐sections stained for TITIN (green). Nuclei are counterstained with Hoechst (blue). Scale bar, 20 µm. Inset shows a higher magnification, evidencing sarcomeric organization of myofiber cytoskeleton highlighted by arrowheads. g) ISL1 gene expression in rSkMs and in NMO‐rSkMs. Data are normalized to housekeeping B2‐microglobulin gene expression and shown as fold change over rSkM. Data shown as mean ± s.d. of three independent biological replicates for rSkM and of six independent biological replicates for NMO‐rSkM. Mann‐Whitney U test; ns, not statistically significant; *p = 0.0238. h. Representative Z‐stack confocal immunofluorescence image of NMO‐rSkM cross‐sections stained for TUJ1 (red), DESMIN (cyan) and α‐bungarotoxin+ (BTX) regions (green). Nuclei are counterstained with Hoechst (blue). Higher magnification of Figure 3g. is shown in h) White arrows indicate putative NMJ where signals colocalized. Scale bars, 50 µm (g) and 10 µm (h). i) Representative Z‐stack confocal immunofluorescence image of NMO‐rSkM cross‐sections stained for TUJ1 (red), BTX (green) and S100β (cyan). Nuclei are counterstained with Hoechst (grey). Scale bar, 20 µm (upper panel) and 10 µm (lower panel). White arrows indicate putative NMJ where signals colocalized. j. ACHRɣ gene expression in rSkMs and in NMO‐rSkMs. Data are normalized to housekeeping B2‐microglobulin gene expression and shown as fold change over rSkM. Data shown as mean ± s.d. of three independent biological replicates for rSkM and of six independent biological replicates for NMO‐rSkM. Mann‐Whitney U test; *p = 0.0476. k) ACHRε gene expression in rSkMs and in NMO‐rSkMs. Data are normalized to housekeeping B2‐microglobulin gene expression and shown as fold change over rSkM. Data shown as mean ± s.d. of three independent biological replicates for rSkM and of six independent biological replicates for NMO‐rSkM. Mann‐Whitney U test; *p = 0.0238. l, m) Representative quantification of mean normalized fluorescence intensity variation registered during live imaging analysis of NMO‐rSkMs or NMO‐rSkMs treated for 12 h with BTX and stimulated with Glu (l) or ACh (n). Data are shown as mean ± SEM of 15 ROIs (5 ROIs per sample, from three independent biological replicates) for untreated NMO‐rSkMs (light blue line). Data are shown as mean ± SEM of 10 ROIs (5 ROIs per sample, from two independent biological replicates) for NMO‐rSkMs treated overnight with BTX (crimson line). Dotted lines correspond to the baseline equal to 0. Statistical results are reported in Table S6 (Supporting Information). n, o) Quantification of calcium peak amplitude (ΔF/F0) detected with Fluo‐4 live imaging analysis of rSkM (n = 2), NMO‐rSkM (n = 4) or NMO‐rSkM after BTX treatment (n = 2) after Glu (m) or ACh (o) administration. The fluorescence intensity peak (F) during stimulation was measured and normalized to the baseline fluorescence intensity registered before neurotransmitter stimulation (F0). Mann‐Whitney U test; ns, not statistically significant; ****< 0.0001. Statistical results are reported in Table S7 (Supporting Information).
Figure 4
Figure 4
NMO‐rSkM assembloids possess muscle stem cells and model degeneration and regeneration events upon acute damage. a) Schematic illustration showing the experimental procedure and timeline used to investigate the regenerative ability of NMO‐rSkMs. b) Representative stereomicroscope images showing whole mount immunofluorescence staining for TUJ1 (red) and DESMIN (green) of NMO‐rSkMs at day 35 of co‐culture not treated with cardiotoxin (no CTX) or day 1, day 5 and day 20 after CTX treatment. Scale bar, 1 mm. c) Representative Z‐stack confocal immunofluorescence images for TUJ1 (red) and DESMIN (green), showing a higher magnification of the corresponding stereomicroscope images. Scale bars, 200 µm. d) Representative Z‐stack confocal immunofluorescence images of NMO‐rSkMs at D35 of co‐culture not treated with cardiotoxin (no CTX) or 1 day, 5 days and 20 days after CTX treatment and stained in whole mount for DESMIN (green). Scale bar, 50 µm. e) Quantification of total fluorescence intensity normalized for background signal performed on DESMIN immunofluorescence staining. Data are shown as mean ± SEM of 36 ROIs per biological sample per each condition (n = 3). Statistical significance was determined using Mann‐Whitney U test; ns, not statistically significant. Statistical results are reported in Table S8 (Supporting Information). f) Quantification of myofiber length performed on DESMIN immunofluorescence staining. Data are shown as mean ± SEM of >30 myofibers per sample per each condition (n = 3), measured on ≥ three images per condition. Statistical significance was determined using Mann‐Whitney U test; ****p < 0.0001. g) Quantification of myofiber thickness performed on DESMIN immunofluorescence staining. Data are shown as mean ± SEM of >30 myofiber cross‐sections per sample per each condition (n = 3), measured on ≥ three images per condition. Statistical significance was determined using Mann‐Whitney U test; ****p < 0.0001. Statistical results are reported in Table S10 (Supporting Information). h) Representative Z‐stack confocal immunofluorescence images of NMO‐rSkMs at day 35 of co‐culture not treated with cardiotoxin (no CTX) or 1 day, 5 days and 20 days after CTX treatment and stained in whole mount for TUJ1 (red). Scale bar, 50 µm. i) Quantification of axonal projection length performed on TUJ1 immunofluorescence staining. Data are shown as mean ± SEM of >50 axonal projections per sample per each condition (n = 3), measured on ≥ three images per condition. Statistical significance was determined using Mann‐Whitney U test; ****P<0.0001. Statistical results are reported in Table S11 (Supporting Information). j) Quantification of axonal projection thickness performed on TUJ1 immunofluorescence staining. Data are shown as mean ± SEM of >30 axonal cross‐sections per sample per each condition (n = 3), measured on ≥ three images per condition. Statistical significance was determined using Mann‐Whitney U test; ****p < 0.0001. Statistical results are reported in Table S12 (Supporting Information). k) Quantification of Ki67+ cells among PAX7+ cells in NMO‐rSkMs at day 35 of co‐culture not treated with cardiotoxin (no CTX) or 1 day, 5 days and 20 days after CTX treatment, expressed in percentage. Data are shown as mean ± SEM of ≥ 30 images, from two different biological samples, per each condition. Statistical results are reported in Table S13 (Supporting Information).
Figure 5
Figure 5
Functional muscle regeneration precedes neuronal and NMJ regeneration in NMO‐rSkM assembloids. a) Representative vector maps of displacements registered during contraction of NMO‐rSkMs at day 35 of co‐culture not treated with cardiotoxin (no CTX) or 1 day, 5 days and 20 days after CTX treatment when stimulated with ACh. b) Violin plot showing the maximum displacement of NMO‐rSkMs at day 35 of co‐culture not treated with cardiotoxin (no CTX) or 1 day, 5 days and 20 days after CTX treatment when stimulated with ACh. Each violin represents the mean of the displacement vectors obtained from 3 biological replicates per experimental condition (vector number analyzed ≥ 14951). Statistical significance was determined using one‐way ANOVA with Tukey's multiple comparisons test, ****P<0.0001. Statistical results are reported in Table S14 (Supporting Information). c) Representative polar charts showing quantification of the maximum displacement (µm) and of the displacement directionality (angle, degree) obtained with PIVlab analysis of NMO‐rSkMs at day 35 of co‐culture not treated with cardiotoxin (no CTX) or 1 day, 5 days and 20 days after CTX treatment when stimulated with ACh of three different assemblois (#) per each experimental condition. d) Representative quantification of mean normalized fluorescence intensity variation registered during contraction of NMO‐rSkMs at day 35 of co‐culture not treated with cardiotoxin (no CTX) or 1 day, 5 days and 20 days after CTX treatment when stimulated with ACh. For each curve, data are shown as the mean of 3 independent replicates. e) Contraction quantification of NMO‐rSkM at D35 not treated with cardiotoxin (no CTX) or 1 day, 5 days and 20 days after CTX treatment. Contraction was recorded upon exogenous ACh administration, and is expressed as the maximum peak of fluorescence revealed via live imaging analysis. Quantifications were performed on three independent biological replicates per condition. Each of the three samples was divided into 5 ROIs and every dot represents a single ROI. Statistical significance was determined using Mann‐Whitney U test; ns, not statistically significant. Statistical results are reported in Table S15 (Supporting Information). f) Representative vector maps of displacements registered during contraction of NMO‐rSkMs at day 35 of co‐culture not treated with cardiotoxin (no CTX) or 1 day, 5 days and 20 days after CTX treatment when stimulated with Glu. g) Violin plot showing the maximum displacement of NMO‐rSkMs at day 35 of co‐culture not treated with cardiotoxin (no CTX) or 1 day, 5 days and 20 days after CTX treatment when stimulated with Glu. Each violin represents the mean of the displacement vectors obtained from three biological replicates per experimental condition (vector number analyzed ≥ 15227). Statistical significance was determined using one‐way ANOVA with Tukey's multiple comparisons test, ****p < 0.0001. Statistical results are reported in Table S16 (Supporting Information). h) Representative quantification of mean normalized fluorescence intensity variation registered during contraction of NMO‐rSkMs at day 35 of co‐culture not treated with cardiotoxin (no CTX) or 1 day, 5 days and 20 days after CTX treatment when stimulated with Glu. For each curve, data are shown as the mean of 3 independent replicates. i) Contraction quantification of NMO‐rSkM at D35 not treated with cardiotoxin (no CTX) or 1 day, 5 days and 20 days after CTX treatment. Contraction was recorded upon exogenous Glu administration, and is expressed as the maximum peak of fluorescence revealed via live imaging analysis. Quantifications were performed on three independent biological replicates per condition. Each of the three samples was divided into five ROIs and every dot represents a single ROI. Statistical significance was determined using Mann‐Whitney U test, ***p = 0.0002. Statistical results are reported in Table S17 (Supporting Information) j) Representative Z‐stack confocal immunofluorescence images of NMO‐rSkMs cross sections 20 days after CTX treatment, stained for TUJ1 (red), DESMIN (green) and α‐BTX+ regions (cyan). Scale bars, 50 µm (left) and 20 µm (right).

Similar articles

Cited by

  • Tissue-engineered neuromuscular organoids.
    Auletta B, Chiolerio P, Cecconi G, Rossi L, Sartore L, Cecchinato F, Barbato G, Lauroja A, Maghin E, Easler M, Raffa P, Angiolillo S, Qin W, Frison R, Calabrò S, Villa C, Gagliano O, Laterza C, Cacchiarelli D, Cescon M, Giomo M, Torrente Y, Luni C, Piccoli M, Elvassore N, Urciuolo A. Auletta B, et al. Commun Biol. 2025 Jul 19;8(1):1074. doi: 10.1038/s42003-025-08484-z. Commun Biol. 2025. PMID: 40684029 Free PMC article.

References

    1. Langer R., Vacanti J. P., Science (80‐.). 1993, 260, 920. - PubMed
    1. Elliott M. J., De Coppi P., Speggiorin S., Roebuck D., Butler C. R., Samuel E., Crowley C., McLaren C., Fierens A., Vondrys D., Cochrane L., Jephson C., Janes S., Beaumont N. J., Cogan T., Bader A., Seifalian A. M., Hsuan J. J., Lowdell M. W., Birchall M. A., Lancet 2012, 380, 994. - PMC - PubMed
    1. Paternoster J. L., Vranckx J. J., Tissue Eng. Part B Rev. 2022, 28, 592. - PubMed
    1. Quarta M., Cromie M., Chacon R., Blonigan J., Garcia V., Akimenko I., Hamer M., Paine P., Stok M., Shrager J. B., Rando T. A., Nat. Commun. 2017, 8, 15613. - PMC - PubMed
    1. Alvarèz Fallas M. E., Piccoli M., Franzin C., Sgrò A., Dedja A., Urbani L., Bertin E., Trevisan C., Gamba P., Burns A. J., De Coppi P., Pozzobon M., Int. J. Mol. Sci. 2018, 19, 1319. - PMC - PubMed

LinkOut - more resources