. 2025 Oct;77(10):1373-1386.
doi: 10.1002/art.43210. Epub 2025 Jul 4.

Paradoxical Activation of Entheseal Myeloid Cells by JAK1 and Tyk2 Inhibitors via Interleukin-10 Antagonism

Affiliations

Paradoxical Activation of Entheseal Myeloid Cells by JAK1 and Tyk2 Inhibitors via Interleukin-10 Antagonism

Sami Giryes et al. Arthritis Rheumatol. 2025 Oct.

Abstract

Objective: JAK inhibition (JAKi) is effective in seronegative spondyloarthropathy (SpA) spectrum disorders, but Tyk2 inhibition failed in SpA spectrum ulcerative colitis, and tofacitinib showed minimal benefit in Crohn disease, which highlights the complex role for JAK/STAT signaling in different inflammatory processes. In this study, we investigated whether JAKi might paradoxically activate entheseal innate immunity and aimed to identify the key regulatory cytokines involved in this process.

Methods: Spinal entheseal tissue was activated with Toll-like receptor (TLR) agonists, including TLR4 and interleukin-1 (IL-1) family proteins, and entheseal T cells were activated with anti-CD3/anti-CD28 with IL-23/IL-1β. JAKi via upadacitinib (JAK1/JAK2), deucravacitinib (Tyk2), and ritlecitinib (JAK3) inhibition was evaluated using multiplex cytokine assays, intracellular flow, and bulk RNA sequencing (RNAseq) and cytokine blocking or stimulation.

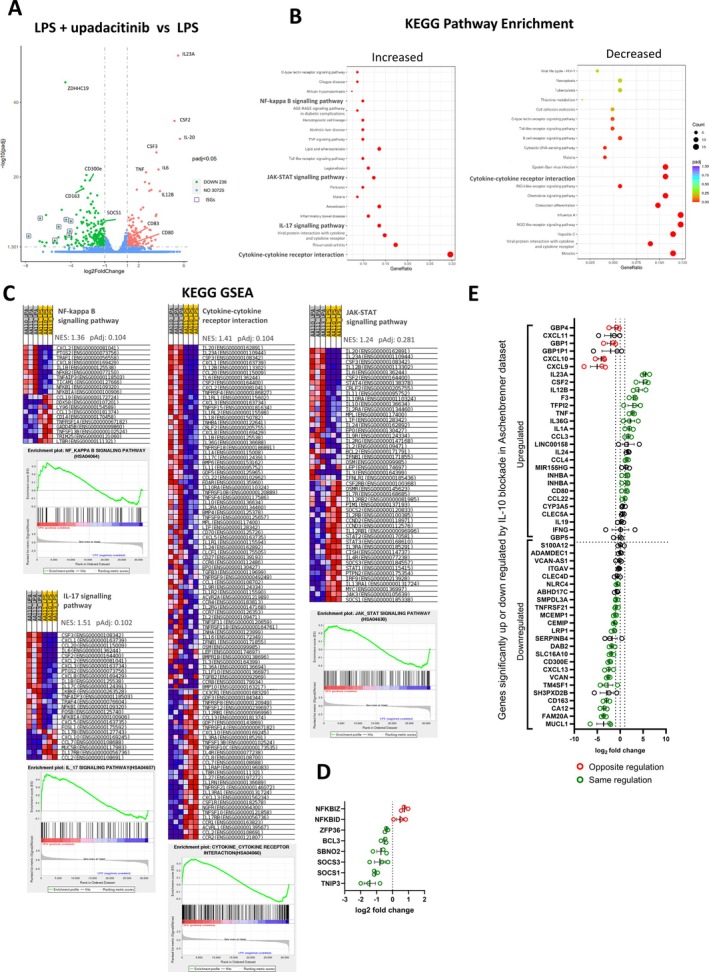
Results: Following interferon γ stimulation, JAK1 inhibition blocked STAT1 phosphorylation in entheseal cells and strongly blocked activated entheseal T cell tumor necrosis factor α (TNFα), IL-17A, and IL-17F production. The opposite effect was evident in entheseal myeloid cell with exaggerated TLR4 and other adjuvant-mediated cytokine production including IL-23 (~10-fold increase; P < 0.001) or TNFα (~10-fold increase; P < 0.0001). This myeloid effect was induced by upadacitinib and deucravacitinib but not ritlecitinib, suggesting IL-10R JAK1/Tyk2 signaling. Bulk RNAseq showed a multifaceted impact of JAKi on myeloid activation with strong M1 type monocyte polarization under TLR4 stimulation and JAK1 inhibition confirmed by flow cytometry. Direct IL-10 inhibition recapitulated inflammatory cytokine elevations and IL-10R agonist largely, but not completely, rescued this phenotype.

Conclusion: These findings help explain the emergent efficacy of Tyk2 blockade in SpA spectrum-related arthritis that is not IL-10 dependent but indicates why such strategies may not be a panacea for SpA spectrum disorder-related intestinal inflammation.


Figures

Figure 1
Figure 1
JAK1 inhibition strongly inhibits entheseal T cell activity. (A) Isolated entheseal cells untreated or stimulated with IFNγ (20 ng/mL; 15 minutes) with or without Upa (10 μM) and pSTAT1 measured by flow cytometry. (B) Isolated entheseal cells stimulated with anti‐CD3 (1 μg/mL), anti‐CD28 (2.5 μg/mL), IL‐1β, and IL‐23 (25 ng/mL each) for 48 hours for T cell activation with and without indicated concentrations of upadacitinib. Secreted cytokines TNFα (n = 5), IL‐17A (n = 5), and IL‐17F (n = 4) were measured by enzyme‐linked immunosorbent assay. (C) Enriched CD3+ entheseal cells were treated as in panel B and analyzed for intracellular IL‐17A and TNFα by flow cytometry. Gating strategy is shown in Supplementary Figure S1. Dot plots show CD45+CD3+ gated population (gating strategy Supplementary Figure S1). Flow cytometry (A and C) is representative of three independent experiments. *P < 0.05 (statistical test), data are presented as means with SEMs (B). Act, activation; FMO, fluorescence minus one; IFNγ, interferon γ; IL‐17A, interleukin 17A; NS, untreated entheseal cells; pSTAT1, phosphorylated STAT1; TNFα, tumor necrosis factor α; Upa, upadacitinib.
Figure 2
Figure 2
JAK1 inhibition increases NF‐κB–driven IL‐23 and TNFα from CD14+ entheseal cells. Entheseal cells untreated or stimulated with LPS (10 ng/mL) with an indicated concentration of Upa for 24 hours and (A and C) IL‐23 and (B and D) TNFα measured by enzyme‐linked immunosorbent assay (ELISA). (E) Entheseal cells stimulated with LPS, mannan, zymosan, IL‐1β, IL‐36α with and without 1 μM Upa, and IL‐23 measured by ELISA. (F) Peripheral blood leukocytes, CD14+ depleted peripheral blood leukocytes, or isolated CD14+ cells were treated with 10 ng/mL LPS with or without Upa. Figures are representative of (A) 11, (B) 9, (C) 5, or (D–E) 3 independent experiments. *P < 0.05, **P < 0.01, ***P < 0.001, ****P < 0.0001 (statistical test). Data are presented as means with SEMs. IL‐23, interleukin 23; LPS, lipopolysaccharide; NS, untreated entheseal cells; PEB, peri‐entheseal bone; TNFα, tumor necrosis factor α; Upa, upadacitinib. Color figure can be viewed in the online issue, which is available at http://onlinelibrary.wiley.com/doi/10.1002/art.43210/abstract.
Figure 3
Figure 3
RNA sequencing (RNAseq) highlights extensive innate immune activity and indicates disrupted negative feedback. (A) Volcano plot displaying differentially expressed genes from RNAseq data between entheseal cells treated with LPS (10 ng/mL) and upadacitinib (Upa) (1 μM) and entheseal cells treated with LPS alone for 12 hours. Genes of interest and interferon stimulated genes are annotated. Green indicates down‐regulated in LPS + Upa versus LPS alone. Red indicates up‐regulated in LPS + Upa versus LPS alone. (B) Dot plots of 20 most significantly up‐regulated and down‐regulated KEGG pathways enriched in LPS + Upa condition vs LPS alone. Dot size indicates counts of genes enriched in the pathway; color indicates significance. Pathways of interest are emboldened. (C) GSEA of KEGG pathways of interest highlighted in B showing normalized enrichment scores, expression heatmaps for leading edge genes in the gene set, and GSEA plots. (D) Log2 fold‐change in genes known to regulate NF‐κB activity. Green indicates down‐regulated in LPS + Upa versus LPS alone. Red indicates up‐regulated in LPS + Upa versus LPS alone. (E) Comparison of Log2 fold‐change in gene expression of our LPS + Upa versus LPS alone data set to a gene set of significantly regulated genes identified by Aschenbrenner et al comparing LPS + IL‐10R blockade to LPS alone. Colored points signify genes are significantly differentially expressed (adjusted P < 0.05). Green points indicate genes are regulated in the same direction in both our data set and the data set from Aschenbrenner et al; red points indicate genes are regulated in the opposite direction in each data set. Data are representative of three independent experiments. Adjusted P values calculated using Benjamin and Hochberg's approach. GSEA, gene set enrichment analysis; IL‐10R, interleukin 10R; KEGG, Kyoto Encyclopedia of Genes and Genomes; LPS, lipopolysaccharide; NFKBIZ, NF‐κB inhibitor zeta; SBNO2, Strawberry notch homolog 2; SOCS1, suppressor of cytokine signaling 1; Upa, upadacitinib; ZFP36, zinc‐finger protein 36. Color figure can be viewed in the online issue, which is available at http://onlinelibrary.wiley.com/doi/10.1002/art.43210/abstract.
Figure 4
Figure 4
Disrupted IL‐10 and JAK1/Tyk2 negative feedback pathways lead to increased myeloid activity in JAK‐inhibited entheseal cells. (A) Entheseal cells were untreated or stimulated with LPS (10 ng/mL) and either Upa or anti–IL‐10Rα neutralizing antibody at the indicated concentrations, and secreted IL‐23 measured by enzyme‐linked immunosorbent assay (ELISA). (B) Entheseal cells treated with both LPS (10 ng/mL) and Upa (0.1 μM) were given an increasing concentration of recombinant IL‐10, and secreted IL‐23 measured by ELISA. (C and D) Donor‐matched peripheral blood leukocytes (red) and entheseal cells (PEB; blue) were pretreated with indicated concentration of cytokine‐ or receptor‐neutralizing antibodies before stimulation with LPS (10 ng/mL). Data show IL‐23 secretion expressed as a percentage of IL‐23 induced by 10 ng/mL LPS + 1 μM Upa. The asterisk indicates significance compared to LPS condition in peripheral blood, whereas the pound sign (#) indicates significance compared to LPS in PEB. The double dagger sign (‡) indicates significance < 0.05 between peripheral blood and PEB of the same condition. (D) Data illustrating lack of IL‐23 induction following blockade of IL‐19 or type I IFN signalling prior to LPS stimulation. (E and F) Entheseal cells were treated with LPS (10 ng/mL) with or without 10 μM to 1 nM Upa, Deucra (Tyk2 inhibitor), or Ritle (JAK3 inhibitor) for 24 hours. (E) IL‐23 and (F) TNFα were measured by ELISA. Data are expressed as fold increase over LPS‐stimulated cells. Figures are representative of four independent experiments. *P < 0.05, **P < 0.01, ****P < 0.0001, ###P < 0.001, data are mean with SEM. Deucra, deucravacitinib; IL‐10, interleukin 10; LPS, lipopolysaccharide; NS, untreated entheseal cells; PEB, peri‐entheseal bone; Ritle, ritlecitinib; TNFα, tumor necrosis factor α; Upa, upadacitinib. Color figure can be viewed in the online issue, which is available at http://onlinelibrary.wiley.com/doi/10.1002/art.43210/abstract.
Figure 5
Figure 5
JAK1 inhibition favors M1 phenotype development in entheseal monocytes. (A) Expression of CD163, CD80, and CD209 in entheseal CD14+ monocytes (CD45+CD3CD19CD14+HLA‐DR+). Entheseal cells were stimulated with LPS (10 ng/mL) with or without Upa (1 μM) for 24 hours and expression of M1‐phenotype marker (CD80) and M2‐phenotype markers (CD163 and CD209) were assessed by (A and B) flow cytometry. Gating strategy is shown in Supplementary Figure S1. (B) MFI was calculated for quantification of expression levels. P values are displayed on figures. Figures are representative of four independent experiments. Data are presented as means with SEMs. LPS, lipopolysaccharide; MFI, median fluorescence intensity; NS, untreated entheseal cells; Upa, upadacitinib. Color figure can be viewed in the online issue, which is available at http://onlinelibrary.wiley.com/doi/10.1002/art.43210/abstract.
Figure 6
Figure 6
JAK1 inhibition blocks type‐17 cytokine production despite increased myeloid‐derived Th17‐driving cytokines. Entheseal cells treated with LPS (10 ng/mL) with or without Upa (1 μM), anti‐CD3 (CD3) with or without upadacitinib, or LPS + anti‐CD3 with and without Upa for 48 hours. Secreted (A) IL‐23, (B) IL‐6, (C) TNFα, (D) IL‐17A, (E) IL‐17F, and (F) IL‐22 were measured by bead‐based immunoassays. Figures are representative of three (A and B) and five (C–F) independent experiments. *P < 0.05, **P < 0.01, **P < 0.001, ****P < 0.0001. Data are presented as means with SEMs. IL‐23, interleukin 23; LPS, lipopolysaccharide; NS, untreated entheseal cells; TNFα, tumor necrosis factor α; Upa, upadacitinib. Color figure can be viewed in the online issue, which is available at http://onlinelibrary.wiley.com/doi/10.1002/art.43210/abstract.

References

    1. Sherlock JP, Joyce‐Shaikh B, Turner SP, et al. IL‐23 induces spondyloarthropathy by acting on ROR‐γt+ CD3+CD4−CD8− entheseal resident T cells. Nat Med 2012;18(7):1069–1076. - PubMed
    1. Bridgewood C, Sharif K, Sherlock J, et al. Interleukin‐23 pathway at the enthesis: the emerging story of enthesitis in spondyloarthropathy. Immunol Rev 2020;294(1):27–47. - PubMed
    1. Russell T, Bridgewood C, Rowe H, et al. Cytokine “fine tuning” of enthesis tissue homeostasis as a pointer to spondyloarthritis pathogenesis with a focus on relevant TNF and IL‐17 targeted therapies. Semin Immunopathol 2021;43(2):193–206. - PMC - PubMed
    1. McInnes IB, Szekanecz Z, McGonagle D, et al. A review of JAK‐STAT signalling in the pathogenesis of spondyloarthritis and the role of JAK inhibition. Rheumatology (Oxford) 2021;61(5):1783–1794. - PMC - PubMed
    1. Hu X, Li J, Fu M, et al. The JAK/STAT signaling pathway: from bench to clinic. Signal Transduct Target Ther 2021;6(1):402. - PMC - PubMed

MeSH terms

Grants and funding