. 2025 Jun;603(12):3533-3550.
doi: 10.1113/JP288109. Epub 2025 May 5.

Pathogenic TNNT1 variants are associated with aberrant thin filament compliance and myofibre hyper-contractility

Affiliations

Pathogenic TNNT1 variants are associated with aberrant thin filament compliance and myofibre hyper-contractility

Jenni Laitila et al. J Physiol. 2025 Jun.

Abstract

In skeletal muscle, troponin T (TnT) exists in two isoforms, slow skeletal TnT (ssTnT) and fast skeletal TnT (fsTnT), encoded by the TNNT1 and TNNT3 genes, respectively. Nonsense or missense TNNT1 variants have been associated with skeletal muscle weakness and contractures and a histopathological appearance of nemaline myopathy (NM) on muscle biopsy. Little is known about how TNNT1 mutations ultimately lead to muscle dysfunction, preventing the development of targeted therapeutic interventions. Here, we aimed to identify the underlying molecular biophysical mechanisms, by investigating isolated skeletal myofibres from patients with TNNT1-related NM as well as from controls through a combination of structural and functional assays. Our studies revealed variable and unusual ssTnT and fsTnT expression patterns and post-translational modifications. We also observed that, in the presence of TNNT1 variants, the thin filament was more compliant, and this was associated with a higher myofibre Ca2+ sensitivity. Altogether, our findings suggest TnT remodelling as the key mechanism ultimately leading to molecular and cellular hyper-contractility, and then inhibitors of altered contractility as potential therapeutic modalities for TNNT1-associated NM. KEY POINTS: No therapeutic treatment exists for patients with genetic TNNT1 mutations and skeletal muscle weakness/contractures. In these patients, expression and post-translational modifications of troponin T are severely disrupted. These are associated with changes in thin filament compliance where troponin T is located. All these induce muscle fibre hyper-contractility that can be reversed by mavacamten, a myosin ATPase inhibitor.

Keywords: congenital myopathy; contracture; force; skeletal muscle; troponin.


Conflict of interest statement

C.T.A.L. is an employee of Novo Nordisk A/S. This position began after their work on this paper and the position had no influence on the results or conclusions drawn. M.W.L. is the CEO and founder of Diverge Translational Science Laboratory, which works with numerous companies in the areas of therapeutic development and testing. His work at Diverge is unrelated to the therapeutic options discussed here and his position had no influence on the results or conclusions drawn. A.L.H. is an owner of Accelerated Muscle Biotechnologies Consultants LLC, which performed the X‐ray data reduction and analysis, but services rendered were not linked to outcome or interpretation.

Figures

Figure 1
Figure 1. Histological abnormalities
A, representative muscle cross‐sections from one control and two patients. These patients classified as mild or severe (Table 1) have varying expressions of ssTnT and fsTnT in slow twitch (MyhI) and fast twitch (MyHIIA) muscle fibres. Magnification, 10×; scale bar = 100 µm. B and C, fibre type proportions are displayed for controls and for all pooled patients (B) or for patients separated according to their phenotypes: mild or severe (C). D and E, similarly, cross‐sectional areas (CSAs) for both slow and fast twitch fibres are presented for controls and pooled patients (D) or mild/severe cases (E). Mean, standard deviations and/or individual data points (circles) are shown. Two‐way ANOVAs with Tukey's post hoc test were applied to compare groups (level of significance P < 0.05). [Colour figure can be viewed at wileyonlinelibrary.com]
Figure 2
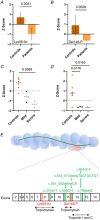
Figure 2. TnT post‐translational modifications
AD, the Z‐score for two specific post‐translational modifications, Lys58‐Ac and Ser148‐P. Mean, standard deviations and/or individual data points (circles) are presented. Unpaired t tests with Welch correction (A and B) or one‐way ANOVAs with Tukey's post hoc test (C and D) were used to compare groups (level of significance P < 0.05). E, an overview of the mutations (in green) and post‐translational modifications (in red) along the sequence/exons of TnT. Regions where tropomyosin as well as troponin I and C bind are also shown. [Colour figure can be viewed at wileyonlinelibrary.com]
Figure 3
Figure 3. Model of fsTnT in the thin filament junction
A, cartoon representation of the human skeletal thin filament junction after energy minimization, showing fsTnT (orange), tropomyosin (blue) and actin (white, with the subunits interacting with fsTnT coloured in grey). The region with altered interaction patterns in WT and Lys58Gln MD trajectories is highlighted in magenta. B and C, close‐up view of the fsTnT (orange liquorice) and actin (grey) residues involved in altered HB interactions (B) and inter‐residue contacts (C). [Colour figure can be viewed at wileyonlinelibrary.com]
Figure 4
Figure 4. Rewiring of the HB network illustrated with WT structures
A, occupancy of HB interactions (calculated as the percentage of frames where a given HB interaction is observed) for selected residue pairs from fsTnT and actin. Average values calculated over five replicas are shown for Lys58Gln (orange) and WT (dark orange) MD simulations, with the standard deviation of the mean shown as a bar. Values calculated for both sets of chains (fsTnT chains K and P, and actin chains C and D) are shown for each interaction. B and C, representative structures extracted through a cluster analysis of WT trajectories to illustrate the HB interactions 1–4, which are on average stronger in WT than Lys58Gln simulations. A close‐up view of residues from the P (fsTnT) and D (actin) chains is shown. [Colour figure can be viewed at wileyonlinelibrary.com]
Figure 5
Figure 5. Rewiring of the HB network illustrated with Lys58Gln structures
A, occupancy of HB interactions (calculated as the percentage of frames where a given HB interaction is observed) for selected residue pairs from fsTnT and actin. Average values calculated over five replicas are shown for Lys58Gln (orange) and WT (dark orange) MD simulations, with the standard deviation of the mean shown as a bar. Values calculated for both sets of chains (fsTnT chains K and P, and actin chains C and D) are shown for each interaction. B and C, representative structures extracted through a cluster analysis of Lys58Gln trajectories to illustrate the HB interactions 5–7, which are on average stronger in Lys58Gln than WT simulations. A close‐up view of residues from the K (fsTnT) and C (actin) chains is shown. [Colour figure can be viewed at wileyonlinelibrary.com]
Figure 6
Figure 6. Contact analysis
A and B, occupancy of contacts (calculated as the fraction of frames where a given contact is observed) for selected residue pairs from fsTnT and actin. Average values calculated over five replicas are shown for Lys58Gln (orange) and WT (dark orange) MD simulations, with the standard deviation of the mean shown as a bar. Values calculated for fsTnT (chain K) – actin (chain C) and fsTnT (chain P) – actin (chain D) pairs are shown in A and B, respectively. [Colour figure can be viewed at wileyonlinelibrary.com]
Figure 7
Figure 7. Thin filament compliance
A, typical X‐ray diffraction patterns obtained from one control and one mild patient. B, the meaning of the two main reflections studied here, i.e. the 6th actin layer line, ALL6, and 3rd troponin reflection, TN3. C, D and E, mean and standard deviations. Unpaired t‐tests with Welch correction were used to compare groups (level of significance P < 0.05). [Colour figure can be viewed at wileyonlinelibrary.com]
Figure 8
Figure 8. Myofibre Ca2+ sensitivity
A, representative force–pCa curves from one control and one mild patient. B and C, Ca2+ sensitivity is displayed for controls and for all pooled patients (B) or for patients separated according to their phenotypes: mild or severe (C). D and E, correlations between Ca2+ sensitivity and Lys58‐Ac Z‐score (D) or Ser148‐P Z‐score (E). F and G, specific force is shown for controls and for all patients (F) or for mild vs. severe patients (G). Mean, standard deviations and/or individual data points (circles) are shown. A mixed effects models were used to analyse the data as previously published (Krivickas et al., 2011) (level of significance P < 0.05). * P < 0.05. Otherwise, for D and E, regression analyses were performed and the R 2 is presented for the only significant correlation. [Colour figure can be viewed at wileyonlinelibrary.com]
Figure 9
Figure 9. Muscle fibre response to a contractile inhibitor
AD, Ca2+ sensitivity in both slow twitch and fast twitch muscle fibres with varying concentrations of mavacamten (0, 1, 5 and 10 µM). Individual data points (circles) are shown for pooled patients or patients divided according to their phenotypes: mild or severe. Two‐way ANOVAs with repeated measures and post hoc analyses were performed with P < 0.05 as level of significance (Factor 1: group of individuals – Factor 2: mavacamten concentration). *Differences when compared with 0 µM mavacamten, irrespective of the group. [Colour figure can be viewed at wileyonlinelibrary.com]

Similar articles

References

    1. Abdulhaq, U. N. , Daana, M. , Dor, T. , Fellig, Y. , Eylon, S. , Schuelke, M. , Shaag, A. , Elpeleg, O. , & Edvardson, S. (2016). Nemaline body myopathy caused by a novel mutation in troponin T1 (TNNT1). Muscle, & Nerve, 53(4), 564–569. - PubMed
    1. Antonovic, A. K. , Ochala, J. , & Fornili, A. (2023). Comparative study of binding pocket structure and dynamics in cardiac and skeletal myosin. Biophysical Journal, 122(1), 54–62. - PMC - PubMed
    1. Berg, S. , Kutra, D. , Kroeger, T. , Straehle, C. N. , Kausler, B. X. , Haubold, C. , Schiegg, M. , Ales, J. , Beier, T. , Rudy, M. , Eren, K. , Cervantes, J. I. , Xu, B. , Beuttenmueller, F. , Wolny, A. , Zhang, C. , Koethe, U. , Hamprecht, F. A. , & Kreshuk, A. (2019). ilastik: Interactive machine learning for (bio)image analysis. Nature Methods, 16(12), 1226–1232. - PubMed
    1. Chan, C. , Fan, J. , Messer, A. E. , Marston, S. B. , Iwamoto, H. , & Ochala, J. (2016). Myopathy‐inducing mutation H40Y in ACTA1 hampers actin filament structure and function. Biochimica Et Biophysica Acta, 1862(8), 1453–1458. - PMC - PubMed
    1. Claassen, W. J. , Baelde, R. J. , Galli, R. A. , de Winter, J. M. , & Ottenheijm, C. A. C. (2023). Small molecule drugs to improve sarcomere function in those with acquired and inherited myopathies. American Journal of Physiology‐ Cell Physiology, 325(1), C60–C68. - PMC - PubMed

LinkOut - more resources