Review
. 2025 Jan;30(Suppl 1):S13711.
doi: 10.1117/1.JBO.30.S1.S13711. Epub 2025 May 2.

Perspective on the use of fluorescence molecular imaging for peripheral and deep en face margin assessment

Affiliations
Review

Perspective on the use of fluorescence molecular imaging for peripheral and deep en face margin assessment

Hang M Nguyen et al. J Biomed Opt. 2025 Jan.

Abstract

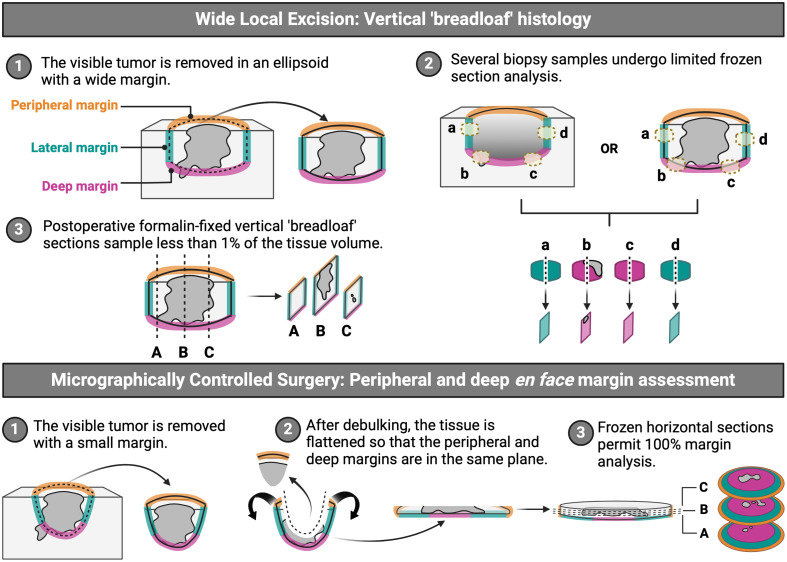
Significance: Current standard practice for margin assessment in solid tumor resection often leads to suboptimal results due to the inability to assess margins completely in a time-efficient manner. On the other hand, for small skin cancers, peripheral and deep en face margin assessment (PDEMA) offers 100% assessment of margins while sparing the utmost amount of normal surrounding tissues. Nonetheless, PDEMA is limited in its use owing to its lengthy tissue processing and imaging time as well as its requirement for high-quality frozen sections and real-time histologic analysis.

Aim: We aim to explore fluorescence molecular imaging (FMI) as a tool for resolving obstacles and integrating PDEMA into the surgeon-to-pathologist workflow for large solid tumors.

Approach: A review of recent pre-clinical and clinical studies using FMI to assess surgical margins was conducted to highlight promising fluorescence imaging technologies utilized in the surgical suite and laboratory.

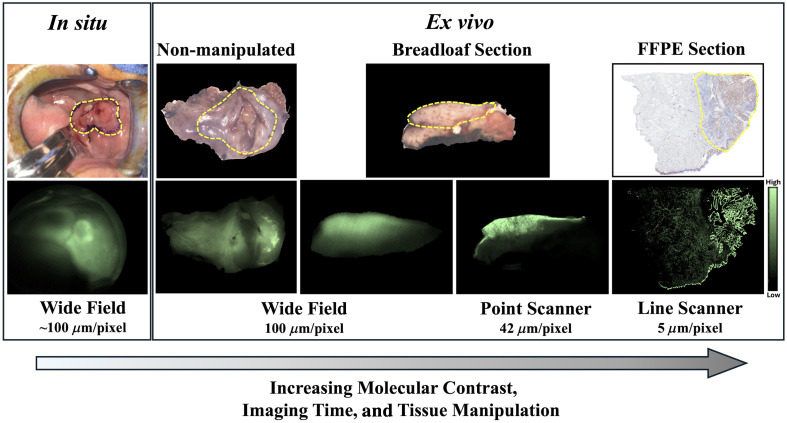
Results: FMI techniques that provide macroscopic resolution are efficient in time and have a notable ability to identify true negative tissue yet have limited capability in identifying true positive tissues. Moreover, meso- and microscopic FMI methods require additional time to attain a higher resolution but deliver an enhanced sensitivity in detecting true positive tissues. In both cases, experts are still required to learn to interpret the FMI signals, which prohibits a seamless clinical integration.

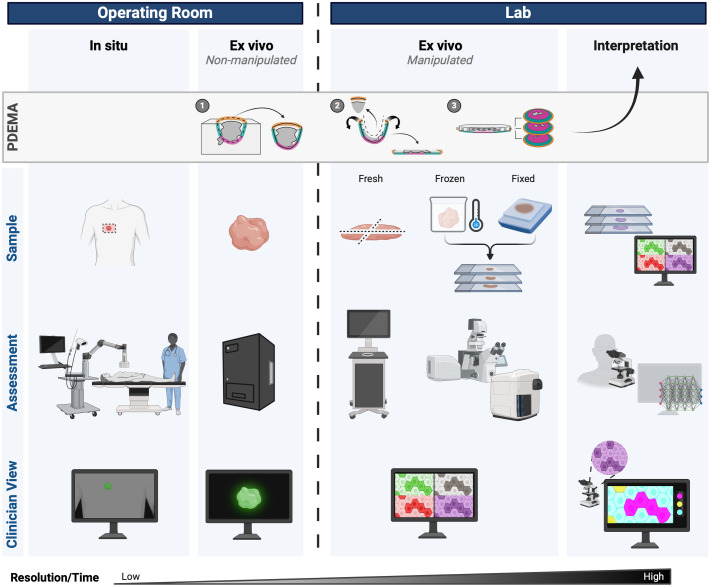
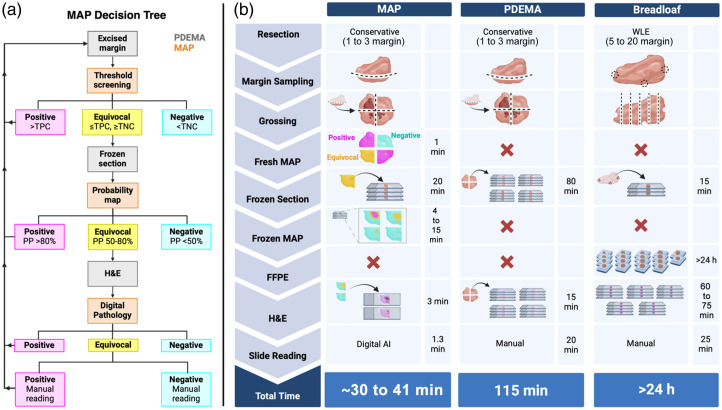
Conclusions: Our proposed margin assessment platform (MAP) incorporates both macroscopic and, meso- or microscopic imaging with post-processing and machine learning for interpretation, to enable the application of PDEMA into solid tumor surgery. MAP leverages the advantages of each technique and thoroughly tackles the limitations of time and expertise to optimize the efficiency and accuracy of margin assessment and ultimately improve clinical outcomes.

Keywords: fluorescence; molecular imaging; peripheral and deep en face margin assessment; tumor margin.


Figures

Fig. 1
Fig. 1
Comparison between breadloaf histology used in conventional wide local excision and peripheral and deep en face margin assessment (PDEMA) employed in micrographically controlled surgery. Created with BioRender.
Fig. 2.
Fig. 2.
Human head and neck cancer tissues shown in RGB (top) and ABY-029 fluorescence (bottom) were imaged in a number of tissue sample configurations. The tumor location is indicated by a yellow dashed line in the RGB images. In situ, wide-field images were collected using a custom-built near-infrared imaging system. Wide-field images of ex vivo non-manipulated and breadloaf section tissues were collected with the Perkin Elmer Solaris. Point scanner images of ex vivo breadloaf sectioned tissues were collected with the LI-COR Odyssey CLx. Line scanner images of ex vivo FFPE sectioned tissue were collected with the LI-COR Odyssey M.
Fig. 3
Fig. 3
Surgeon (operating room) to pathologist (lab) workflow can incorporate fluorescence molecular imaging at every stage. Standard PDEMA (peripheral and deep en face margin assessment) already follows this workflow but without intermediate imaging. Created with BioRender.
Fig. 4
Fig. 4
Clinical examples of in situ imaging. (a) Intraoperative imaging of the lumpectomy cavity using the Lumicell Direct Visualization System. LUM015 fluorescence signal, shown in red, was suggestive of residual tumor (top row), and so an additional shave was taken leaving the new margin negative (bottom row). Adapted from Ref. ; © Jama Network. (b) In vivo dynamic optical contrast imaging (DOCI) of an oral cavity squamous cell carcinoma (OCSCC). DOCI is a label-free tool that makes use of relative fluorescence lifetime values to distinguish tumors from normal tissue. WL: white light. Adapted from Ref. , with permission from John Wiley & Sons, Inc., © 2023 American Academy of Otolaryngology–Head and Neck Surgery Foundation.
Fig. 5
Fig. 5
Examples of ex vivo, non-manipulated fluorescence molecular imaging for margin assessment. (a) Example of ex vivo sentinel margin analysis in an oral squamous cell carcinoma (OSCC) using panitumumab-IRDye800CW. The sentinel margin was predicted by both the surgeon and fluorescence on the mucosal and deep surfaces of the resected specimen. Margin distance was confirmed through sectioning of the suspicious regions and comparing fluorescence with hematoxylin and eosin (H&E) staining. The bottom row demonstrates how maximum fluorescence signal intensity (arrow and red star) was isolated to identify the sentinel margin on the deep surface. Adapted from Ref. , © 2022 Society of Nuclear Medicine and Molecular Imaging. (b) Representative OSCC cases of tumor-positive (top panel) and tumor-negative (bottom panel) margins. In vivo imaging was performed; however, tumor-positive/negative classifications were made based on ex vivo imaging. The strong cetuximab-800CW fluorescence signal was found within the margin of the tumor-positive case, whereas the minimal signal was seen in the margin of the tumor-negative case, which corresponded well with the histopathology. Red arrows indicate a positive margin, and the solid black line outlines the tumor border. Adapted from Ref. , © 2023 de Wit et al.
Fig. 6
Fig. 6
Examples of ex vivo, manipulated imaging for margin assessment. (a) False-colored purple fluorescence confocal microscopy image of freshly excised ductal carcinoma in situ (indicated by *) scanned using the Histolog Scanner, with the corresponding (b) hematoxylin and eosin (H&E) stain. Scale bar=250  μm. Adapted from Ref. , © 2022 M. Sandor et al. (c) Fresh ex vivo, grade 2 prostatic acinar adenocarcinoma scan using the VivaScope 2500M-G4. Fluorescence and reflectance confocal microscopy are combined to generate a two-toned pseudo-colored image to better mimic H&E. (d) Confirming pathology of panel (c). Scale bar=100  μm. Adapted from Ref. , © 2020 Springer-Verlag GmbH. (e)–(j) Frozen section multiphoton microscopy imaging of lung adenocarcinoma. (e) False-colored second harmonic generation (SHG) image, (f) false-colored two-photon excitation fluorescence (TPEF) image, (g) overlaid SHG and TPEF image, and (h) corresponding H&E. Panels (i) and (j) are magnified views of the dashed white box in panels (g) and (h), respectively. Scale bar=100  μm. Adapted from Ref. , with permission from John Wiley & Sons, Inc., © 2023 Wiley-VCH GmbH.
Fig. 7
Fig. 7
Percent probability confidence mapping. (a) Probability density function of all binding potential pixel intensities used to generate (b) a positive probability confidence curve with positive (80%), equivocal (50% to 80%), and negative (50%) thresholds. (c) Demonstration of percent probability confidence mapping applied to frozen sections of mouse xenograft squamous cell carcinoma. H&E: hematoxylin and eosin; EGFR IHC: epidermal growth factor receptor immunohistochemistry; PAI: paired-agent imaging.
Fig. 8
Fig. 8
Methods of signal interpretation for clinical decision making in margin assessment. (a) Optomics probability map of a head and neck squamous cell carcinoma imaged with ABY-029. Three patch sizes (left) were used to generate a continuous tumor probability map (right). Adapted from Ref. , © 2023 Chen et al. (b) A fluorescence lifetime imaging-based classifier was used to produce a prediction probability of cancer in intraoperative margin assessment of low-grade dysplasia (LGD, left) and high-grade dysplasia (HGD, right) in head and neck cancer. The red-to-green probability map is overlaid onto the grayscale image, and color-coded–dotted lines represent the boundaries of healthy, LGD, HGD, and cancer based on annotated histopathology. ROI: region of interest. Adapted with permission from Ref. , © 2023 IEEE. (c) Artificial intelligence was used to enhance the visualization and interpretation of confocal microscopy images of basal cell carcinoma. Predicted tumor positivity maps were generated to automate diagnosis. Se: sensitivity; Sp: specificity. Adapted with permission from Ref. , © Optical Society of America.
Fig. 9
Fig. 9
Example of PDEMA margin assessment platform (MAP) digital pathology for a 3-cm (long axis) tumor. (a) MAP decision tree to stratify tissue samples for histological analysis with macroscopic threshold imaging, meso- to microscopic probability mapping, and gold standard confirmation of histology using digital pathology of frozen sections. The key is that only equivocal tissue specimens continue through the pathway at each step, thus reducing the overall analysis time and permitting margin assessment for cases utilizing general anesthesia. (b) Workflow and time-savings afforded by MAP compared with PDEMA and breadloaf analysis in WLE based on a 3-cm long axis tissue. The workflow is based on PAI with initial ex vivo images collected on en face cut margins using widefield, closed-box imaging. Subsequent PAI images could occur using high-resolution scanning of frozen sections prior to staining and pathological confirmation utilizing digital pathology. TPC: true positive cutoff, TNC: true negative cutoff, PP: positive probability. Created with BioRender.

Similar articles

Cited by

References

    1. Orosco R. K., et al. , “Positive surgical margins in the 10 most common solid cancers,” Sci. Rep. 8, 5686 (2018).SRCEC310.1038/s41598-018-23403-5 - DOI - PMC - PubMed
    1. Blatt S., et al. , “Tumor recurrence and follow-up intervals in oral squamous cell carcinoma,” J. Clin. Med. 11, 7061 (2022).10.3390/jcm11237061 - DOI - PMC - PubMed
    1. Schmults C. D., et al. , “NCCN Guidelines® insights: squamous cell skin cancer, version 1.2022: featured updates to the NCCN guidelines,” J. Natl. Comp. Cancer Network 19, 1382–1394 (2021).10.6004/jnccn.2021.0059 - DOI - PubMed
    1. Skaria A. M., “Recurrence of basosquamous carcinoma after Mohs micrographic surgery,” Dermatology 221, 352–355 (2010).10.1159/000320127 - DOI - PubMed
    1. Leibovitch I., et al. , “Cutaneous squamous cell carcinoma treated with Mohs micrographic surgery in Australia I. Experience over 10 years,” J. Am. Acad. Dermatol. 53, 253–260 (2005).JAADDB - PubMed

Publication types