

Effects of a Plant-Based Diet During the First Month of Feeding on Alevin Rainbow Trout (Oncorhynchus mykiss) in the Development of Tongue Sensory System Regulating Feeding Behavior
- PMID: 40321318
- PMCID: PMC12049252
- DOI: 10.1155/anu/6690967
Effects of a Plant-Based Diet During the First Month of Feeding on Alevin Rainbow Trout (Oncorhynchus mykiss) in the Development of Tongue Sensory System Regulating Feeding Behavior
Abstract
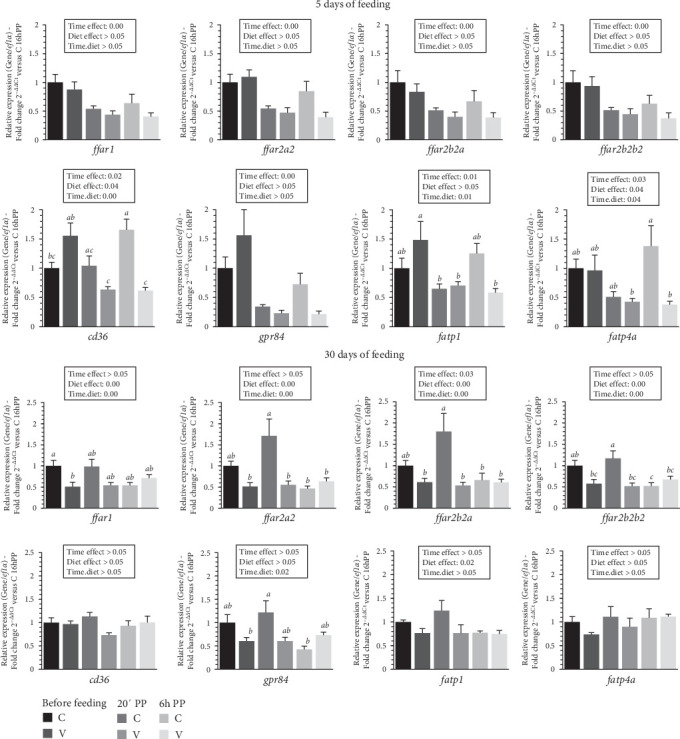
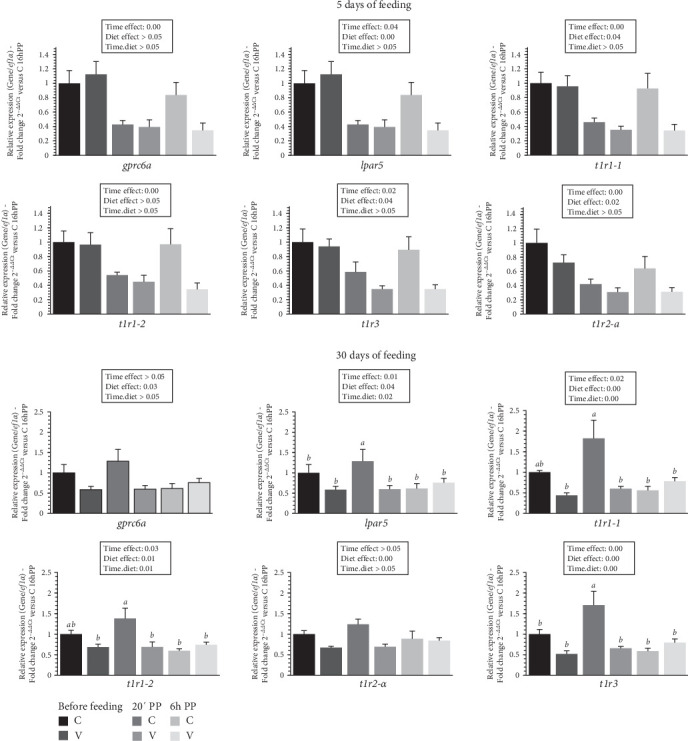
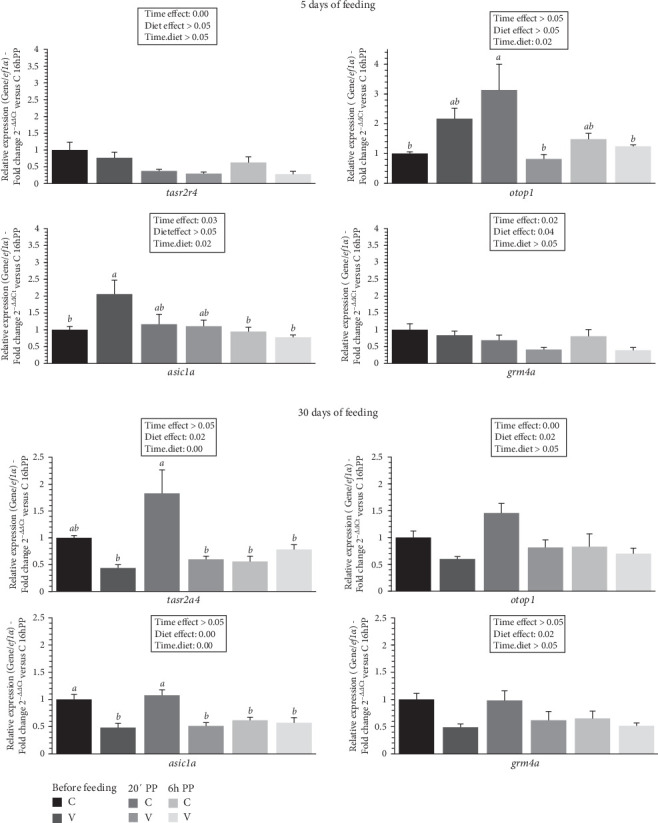
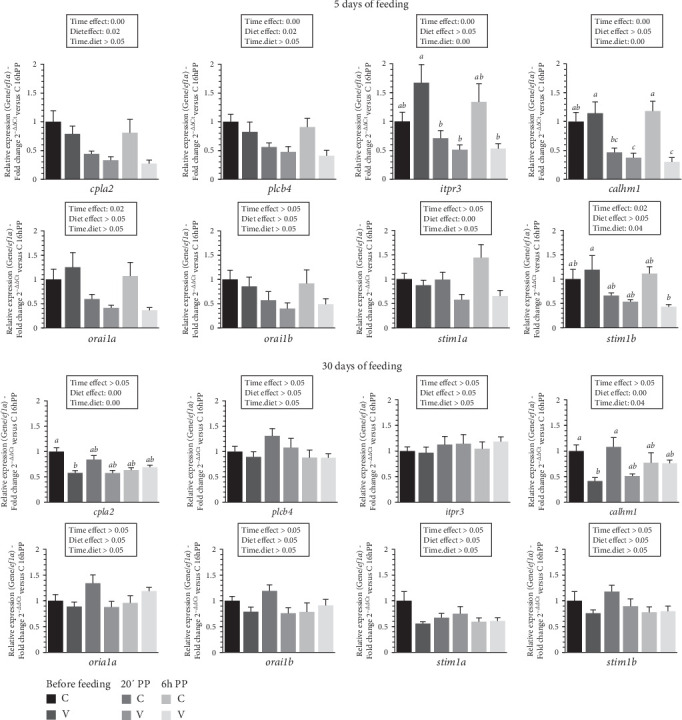
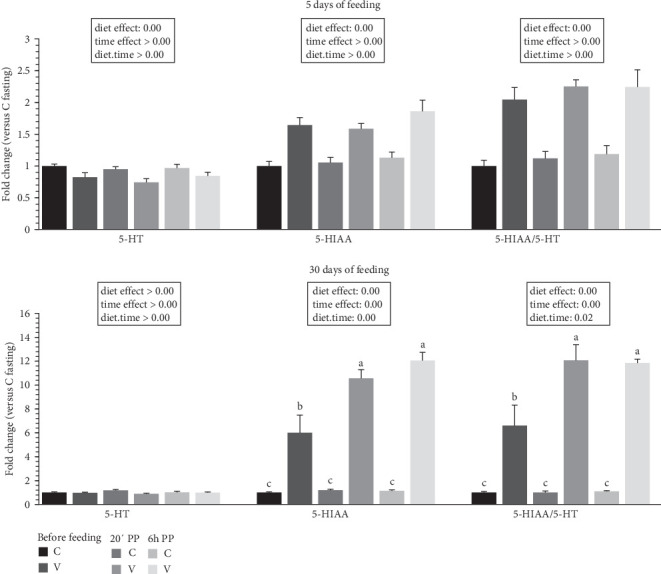
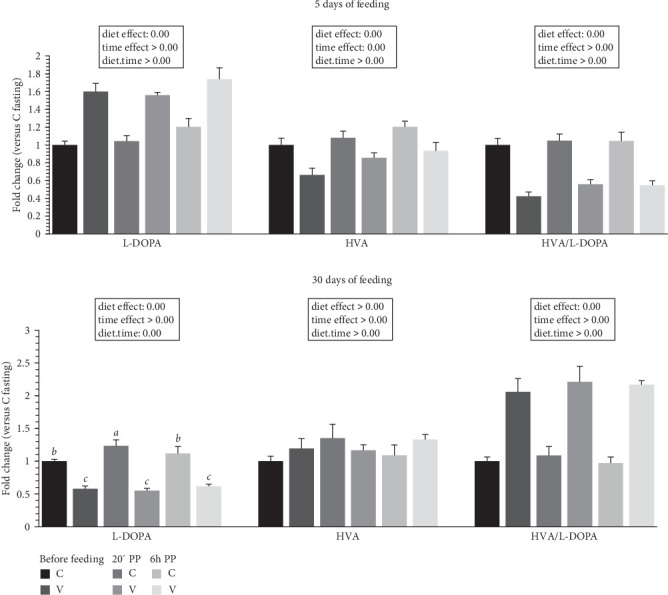
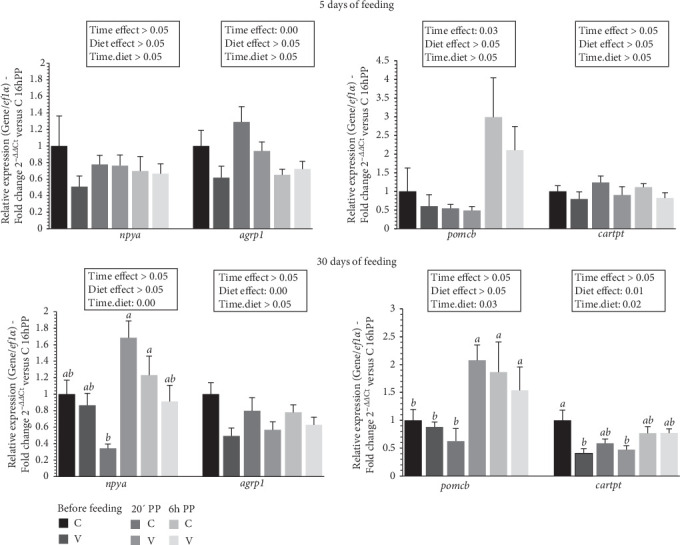
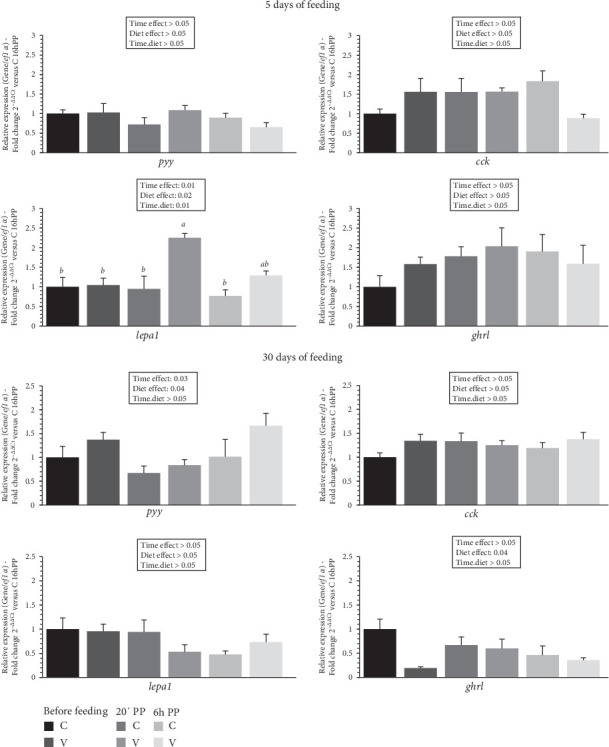
Taste perception is essential for animals to detect nutrients, providing critical dietary information necessary for growth and survival. Since the early growth performance of alevin rainbow trout (Oncorhynchus mykiss) can be affected by food intake influenced by terrestrial ingredients without fish meal and fish oil, our study aimed to evaluate the role of taste receptors in nutrient detection and the associated signaling pathways leading to central nervous system activation in the regulation of feeding behavior. We conducted a nutritional experiment from the first feeding to 30 days, comparing the performance of fish fed a commercial-like diet (C diet: a blend of fish meal, fish oil, and plant ingredients) with those on a totally plant-based diet (V diet). After 5 and 30 days of feeding, fish were fasted for 16 h and then fed either the C or V diet, with sampling conducted at 20 min and 6 h post-meal. We evaluated the expression of nutrient-sensing genes related to fatty acids, amino acids, and sweetness, and taste receptor genes for flavors. Additionally, we examined calcium signaling pathways in the tongue, focusing on indolamine and catecholamine pathways, alongside appetite-regulating neuropeptides in the brain and intestinal hormones in the gut of alevins. Results indicated that fish on the V diet experienced a decrease in body weight gain starting 10 days after feeding to 30 days, along with changes in feed intake during the periods of 0-10 days and 21-30 days after the first meal. In tongue tissue, after 5 days of feeding, fish on the C diet showed a slight upregulation of nutrient taste receptors, but not those related to flavor, along with an upregulation of the calcium signaling pathway. By 30 days, there was a general upregulation of nutrient and flavor taste receptors, although the calcium signaling pathway showed less clear evidence of regulation. A significant dysregulation of the serotonin pathway, along with its degradation, was observed in the tongues of fish fed the V diet at both 5 and 30 days. For the first time in fish, catecholamine quantification levels in the tongue emerged as a potential marker for nutrient detection, with high quantification of L-DOPA after 5 days on the V diet, but much lower after 30 days. This impaired monoamine and catecholamine turnover in the tongue could be linked to a failure in activating the tongue-brain axis, potentially contributing to reduced food intake, as indicated by poorly regulated brain neuropeptides but also intestinal hormones in fish fed the V diet after 30 days. Overall, these findings demonstrate that the V diet disrupts the feeding response at an early stage, underscoring the heightened sensitivity of rainbow trout alevins' tongue sensing systems to novel food sources during critical early development.
Keywords: alevins; feeding behavior; first feeding; plant ingredients; tongue sensing system.
Copyright © 2025 Maud Martinat et al. Aquaculture Nutrition published by John Wiley & Sons Ltd.
Conflict of interest statement
The authors declare no conflicts of interests.
Figures

Similar articles
-
Long-term regulation of fat sensing in rainbow trout (Oncorhynchus mykiss) fed a vegetable diet from the first feeding: focus on free fatty acid receptors and their signalling.Br J Nutr. 2024 Jan 14;131(1):1-16. doi: 10.1017/S0007114523001599. Epub 2023 Jul 20. Br J Nutr. 2024. PMID: 37469170
-
Does broodstock nutritional history affect the response of progeny to different first-feeding diets? A whole-body transcriptomic study of rainbow trout alevins.Br J Nutr. 2016 Jun;115(12):2079-92. doi: 10.1017/S0007114516001252. Epub 2016 Apr 26. Br J Nutr. 2016. PMID: 27112276
-
Molecular pathways associated with the nutritional programming of plant-based diet acceptance in rainbow trout following an early feeding exposure.BMC Genomics. 2016 Jun 13;17:449. doi: 10.1186/s12864-016-2804-1. BMC Genomics. 2016. PMID: 27296167 Free PMC article.
-
Safety and nutritional assessment of GM plants and derived food and feed: the role of animal feeding trials.Food Chem Toxicol. 2008 Mar;46 Suppl 1:S2-70. doi: 10.1016/j.fct.2008.02.008. Epub 2008 Feb 13. Food Chem Toxicol. 2008. PMID: 18328408 Review.
-
Vagal Afferent Signaling and the Integration of Direct and Indirect Controls of Food Intake.In: Harris RBS, editor. Appetite and Food Intake: Central Control. 2nd edition. Boca Raton (FL): CRC Press/Taylor & Francis; 2017. Chapter 11. In: Harris RBS, editor. Appetite and Food Intake: Central Control. 2nd edition. Boca Raton (FL): CRC Press/Taylor & Francis; 2017. Chapter 11. PMID: 28880508 Free Books & Documents. Review.
References
-
- FAO. FAO; 2024. The State of World Fisheries and Aquaculture 2024.
-
- Cottrell R. S., Blanchard J. L., Halpern B. S., Metian M., Froehlich H. E. Global Adoption of Novel Aquaculture Feeds Could Substantially Reduce Forage Fish Demand by 2030. Nature Food . 2020;1(5):301–308. doi: 10.1038/s43016-020-0078-x. - DOI
-
- Lazzarotto V., Médale F., Larroquet L., Corraze G. Long-Term Dietary Replacement of Fishmeal and Fish Oil in Diets for Rainbow Trout (Oncorhynchus mykiss): Effects on Growth, Whole Body Fatty Acids and Intestinal and Hepatic Gene Expression. PLOS ONE . 2018;13(1) doi: 10.1371/journal.pone.0190730.e0190730 - DOI - PMC - PubMed
-
- Baranek E., Heraud C., Larroquet L., et al. Long-Term Regulation of Fat Sensing in Rainbow Trout (Oncorhynchus mykiss) Fed a Vegetable Diet From the First Feeding: Focus on Free Fatty Acid Receptors and Their Signaling. British Journal of Nutrition . 2024;131(1):1–16. doi: 10.1017/S0007114523001599. - DOI - PubMed
LinkOut - more resources
Full Text Sources