

This is a preprint.
Using Natural Language Processing to Track Negative Emotions in the Daily Lives of Adolescents
- PMID: 40321753
- PMCID: PMC12047991
- DOI: 10.21203/rs.3.rs-6414400/v1
Using Natural Language Processing to Track Negative Emotions in the Daily Lives of Adolescents
Abstract
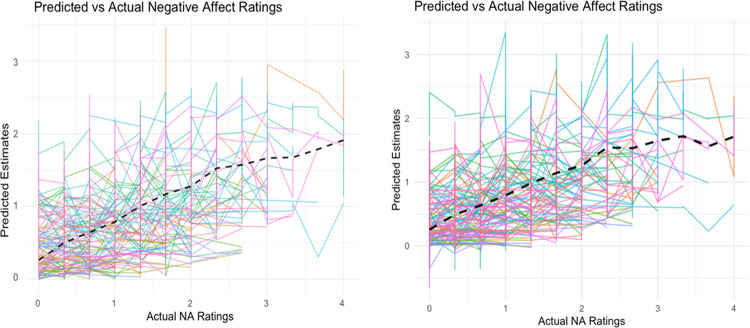
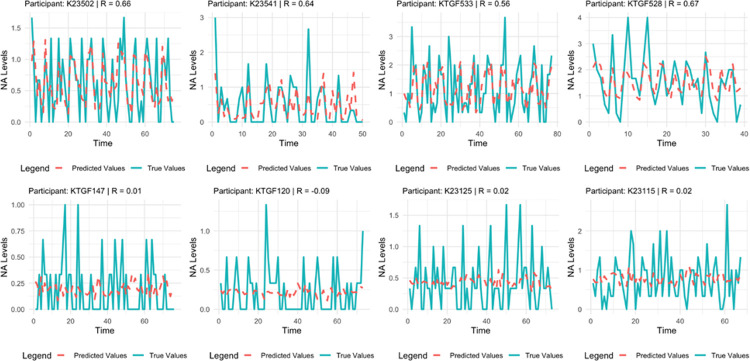
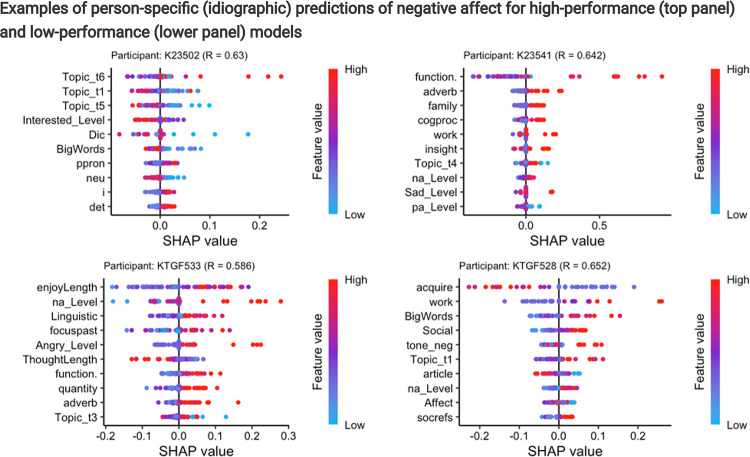
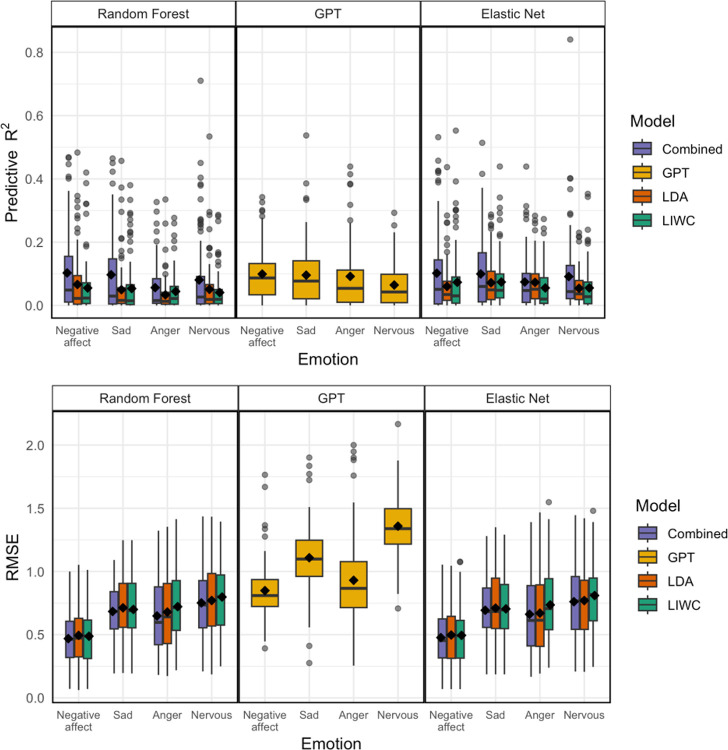
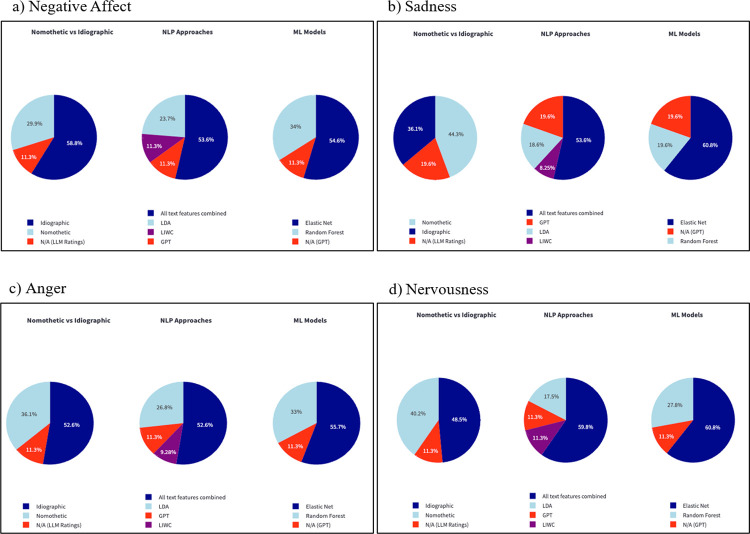
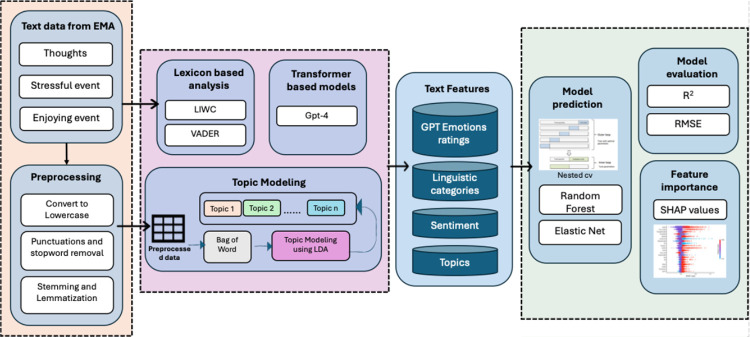
Tracking emotion fluctuations in adolescents' daily lives is essential for understanding mood dynamics and identifying early markers of affective disorders. This study examines the potential of text-based approaches for emotion prediction by comparing nomothetic (group-level) and idiographic (individualized) models in predicting adolescents' daily negative affect (NA) from text features. Additionally, we evaluate different Natural Language Processing (NLP) techniques for capturing within-person emotion fluctuations. We analyzed ecological momentary assessment (EMA) text responses from 97 adolescents (ages 14-18, 77.3% female, 22.7% male, NEMA=7,680). Text features were extracted using a dictionary-based approach, topic modeling, and GPT-derived emotion ratings. Random Forest and Elastic Net Regression models predicted NA from these text features, comparing nomothetic and idiographic approaches. All key findings, interactive visualizations, and model comparisons are available via a companion web app: https://emotracknlp.streamlit.app/. Idiographic models combining text features from different NLP approaches exhibited the best performance: they performed comparably to nomothetic models in R2 but yielded lower prediction error (Root Mean Squared Error), improving within-person precision. Importantly, there were substantial between-person differences in model performance and predictive linguistic features. When selecting the best-performing model for each participant, significant correlations between predicted and observed emotion scores were found for 90.7-94.8% of participants. Our findings suggest that while nomothetic models offer initial scalability, idiographic models may provide greater predictive precision with sufficient within-person data. A flexible, personalized approach that selects the optimal model for each individual may enhance emotion monitoring, while leveraging text data to provide contextual insights that could inform appropriate interventions.
Conflict of interest statement
Additional Declarations: Yes there is potential Competing Interest. Dr. Webb has received consulting fees from King & Spalding law firm. Over the past 3 years, Dr. Pizzagalli has received consulting fees from Arrowhead Pharmaceuticals, Boehringer Ingelheim, Compass Pathways, Engrail Therapeutics, Karla Therapeutics, Neumora Therapeutics (formerly BlackThorn Therapeutics), Neurocrine Biosciences, Neuroscience Software, Sage Therapeutics, and Takeda; he has received honoraria from the American Psychological Association, Psychonomic Society and Springer (for editorial work) and Alkermes; he has received research funding from the Bird Foundation, Brain and Behavior Research Foundation, Dana Foundation, Millennium Pharmaceuticals, NIMH, and Wellcome Leap; he has received stock options from Compass Pathways, Engrail Therapeutics, Neumora Therapeutics, and Neuroscience Software. No funding from these entities was used to support the current work, and all views expressed are solely those of the authors. The other authors declare no competing financial interests.
Figures
References
-
- Frijda N. H. The laws of emotion. American Psychologist 43, 349–358 (1988). - PubMed
-
- Houben M., Van Den Noortgate W. & Kuppens P. The relation between short-term emotion dynamics and psychological well-being: A meta-analysis. Psychological bulletin 141, 901–930 (2015). - PubMed
-
- Houben M. & Kuppens P. Emotion dynamics and the association with depressive features and borderline personality disorder traits: Unique, specific, and prospective relationships. Clinical Psychological Science 8, 226–239 (2020).
Publication types
Grants and funding
LinkOut - more resources
Full Text Sources
Research Materials
