[Preprint]. 2025 Apr 18:rs.3.rs-6436164.
doi: 10.21203/rs.3.rs-6436164/v1.

A genome-wide CRISPR screen identifies GRA38 as a key regulator of lipid homeostasis during Toxoplasma gondii adaptation to lipid-rich conditions

Affiliations

A genome-wide CRISPR screen identifies GRA38 as a key regulator of lipid homeostasis during Toxoplasma gondii adaptation to lipid-rich conditions

Mebratu A Bitew et al. Res Sq. .

Abstract

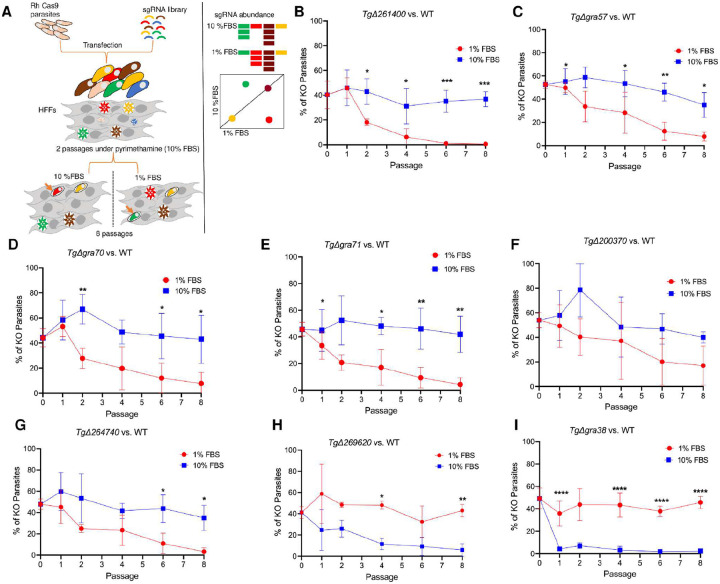
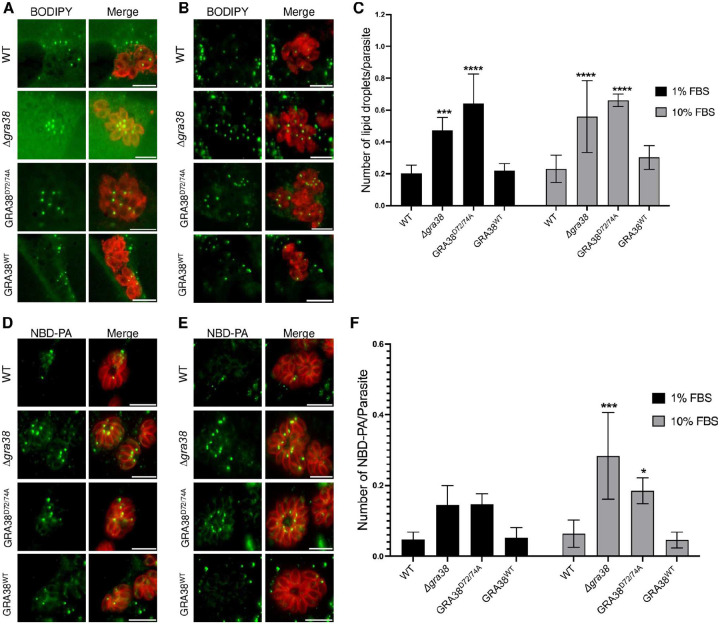
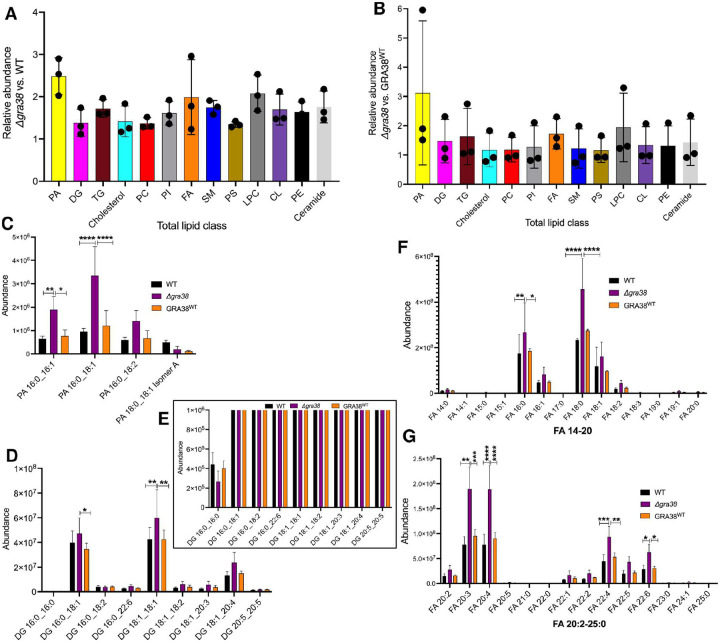
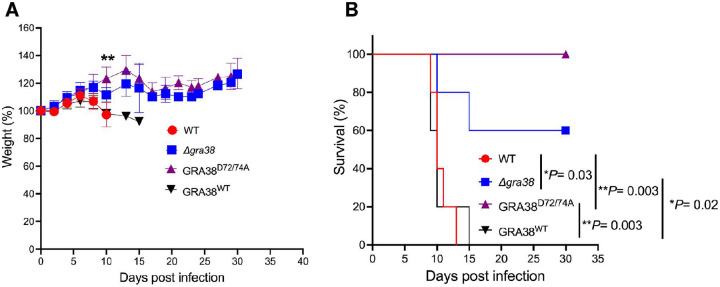
Intracellular parasites like Toxoplasma gondii scavenge host nutrients, particularly lipids, to support their growth and survival. Although Toxoplasma is known to adjust its metabolism based on nutrient availability, the mechanisms that mediate lipid sensing and metabolic adaptation remain poorly understood. Here, we performed a genome-wide CRISPR screen under lipid-rich (10% Fetal Bovine Serum (FBS)) and lipid-limited (1% FBS) conditions to identify genes critical for lipid-responsive fitness. We identified the Toxoplasma protein GRA38 as a lipid-dependent regulator of parasite fitness. GRA38 exhibits phosphatidic acid (PA) phosphatase (PAP) activity in vitro, which is significantly reduced by mutation of its conserved DxDxT/V catalytic motif. Disruption of GRA38 led to the accumulation of PA species and widespread alterations in lipid composition, consistent with impaired PAP activity. These lipid imbalances correlated with reduced parasite virulence in mice. Our findings identify GRA38 as a metabolic regulator important for maintaining lipid homeostasis and pathogenesis in Toxoplasma gondii.

Keywords: CRISPR screen; GRA38; Toxoplasma gondii; host-parasite metabolic interactions; lipidomics; metabolic adaptation; phosphatidic acid phosphatase.


Conflict of interest statement

Additional Declarations: There is NO Competing Interest.

Figures

Figure 1.
Figure 1.. Distinct host cell lipidomic profiles under 1% and 10% FBS growth conditions.
(A) Volcano plot showing the differential abundance of lipid species between host cells grown in 1% and 10% FBS. Lipids significantly enriched in 1% FBS are highlighted on the right, while those enriched in 10% FBS are highlighted on the left (P <0.05). (B) Relative abundance of total lipid classes of HFFs grown with 1% FBS vs. 10% FBS. (C) Comparison of selected lipid species significantly altered (P < 0.05, BH-adjusted t-test) between 1% and 10% FBS conditions, as identified by LC-MS analysis. Lipid species were detected using retention times from representative chromatograms, log-transformed, and expressed as log2 fold changes.
Figure 2.
Figure 2.. Genome-wide CRISPR screen identifies Toxoplasma genes with differential fitness under high or low serum conditions.
(A) Genome-wide CRISPR screen procedure. RH parasite strains expressing Cas9 were transfected with CRISPR plasmids carrying 10 distinct sgRNAs targeting each of 8,156 Toxoplasma genes. The mutant parasite pool was passaged twice in HFFs using media containing 10% FBS and pyrimethamine selection to isolate parasites that had integrated the sgRNA-containing plasmid. After the second passage, the parasites underwent an additional eight rounds of passaging in 1% or 10% FBS medium. The abundance of sgRNAs at the 4t, 5th, and 8th passages was determined by Illumina sequencing, which was then used to compute scores identifying genes exhibiting a fitness deficit in 10% FBS or under 1% FBS parasites. (B-I) Equal proportions of WT and knockout parasites were mixed and cultured in media supplemented with either 1% or 10% FBS over eight serial passages. Plaque numbers were quantified at passages 0, 1, 2, 4, 6, and 8. The percentage of knockout parasites was plotted at each time point. Statistical significance was assessed using a two-way ANOVA followed by Sidak’s multiple comparison test, based on three biological replicates (*P < 0.05, **P < 0.005, ***P < 0.0008, ****P < 0.0001). Data are presented as mean ± SD. All experiments were performed using RH-Luc or RH-Cas9 parasite backgrounds.
Figure 3.
Figure 3.. GRA38 is a dense granule protein highly conserved among apicomplexan parasites.
(A) Immunofluorescence analysis of intracellular parasites showing that GRA38 localizes to the parasitophorous vacuole lumen and co-localizes with GRA7. Human foreskin fibroblasts (HFFs) infected for 24 hours were fixed with 3% formaldehyde and stained with anti-MYC and anti-GRA7 antibodies. The scale bar indicates 8 μm. (B) Immunofluorescence analysis of extracellular parasites shows that GRA38 (anti-MYC tag) co-localizes with GRA7. C) Sequence alignment and analysis of GRA38. Alignment of Toxoplasma GRA38 sequences with other apicomplexan parasites and other eukaryotic organisms was performed using QIAGEN CLC Genomics Workbench 25.0, which scores amino acid conservation. All sequences harbor the evolutionarily conserved catalytic motif DxDxT/V. The scoring scheme ranges from 0% for the least conserved alignment position to 100% for the most conserved. (D) Structural alignment of GRA38 with APP1 using FoldMason in Foldseek, showing similarity in the alignment and overlapping structures. (E) View of the DxDxT/V motif residues of GRA38 with magnesium bound. Polar contacts are indicated by green dashes. (F) Close-up view of the structural rearrangement of key residue interactions in the active catalytic site with manganese bound. (G) Docking of PA to GRA38 by AutoDockVina within the pocket formed by GRA38, interacting directly with the DxDxT/V catalytic motif. (H) Docking of cholesterol as a non-substrate lipid control. (I) A lipid-binding hydrophobic pocket formed by the GRA38 protein, with amino acid motifs lining the pocket.
Figure 4.
Figure 4.. The DxDxT/V catalytic motif is important for GRA38 function.
(A, B) HFFs were plated in 24-well plates with coverslips and then infected with various parasite strains at an MOI of 1 for 24 hours in medium containing either 1% (A) or 10% FBS (B). After infection, cells were fixed and stained with rabbit anti-SAG1 antibody. In each experiment, 100–200 vacuoles were analyzed, and data are presented as average values with ±SD. A two-way ANOVA followed by Tukey’s multiple comparisons test was used to analyze the results (n = 3). (C, D) HFFs were infected with specific parasite strains in medium containing either 1% or 10% FBS. Five days post-infection, plaques were counted, and their areas measured. The plaque counts (C) or parasite growth (D) of knockout parasites were determined. Data are presented as mean ± SD from three independent experiments. Statistical analysis was performed using a two-way ANOVA followed by Tukey’s multiple comparisons test (*P <0.05, n = 3). (E) HFFs were infected with the indicated parasite strains for 24 hours at an MOI of 2. The amount of LDH released into the supernatant was then measured. The graph shows the percentage of LDH released compared to the maximum LDH release measured after treating cells with 2% Triton X-100. Statistical analysis was performed using a two-way ANOVA followed by Dunnett’s multiple comparisons test (**P <0.01, n = 3).
Figure 5.
Figure 5.. Δgra38 parasites accumulate lipid.
(A, B) HFFs were plated in 24-well plates with coverslips and then infected with various parasite strains at an MOI of 1 for 24 hours in medium containing either 1% or 10% FBS. Primary antibody staining was carried out using rabbit anti-SAG1, followed by secondary antibody anti-rabbit Alexa Fluor 594. Lipid droplets were stained with BODIPY 493/503. Shown are representative images from cells grown in 1% FBS (A) or 10% FBS (B). Scale bar indicates 10 μm. (C) Lipid droplets quantified from (A, B). Error bars represent mean ± SD. Statistical analysis was performed using a two-way ANOVA followed by Tukey’s multiple comparisons test (***P = 0.0009, ****P < 0.0001). For WT, Δgra38 and GRA38WT n = 6; for GRA38D72/74A, n = 3. (D, E) HFF monolayers were infected with WT, Δgra38, GRA38D72/74A or GRA38WT strains at an MOI of 0.5 for 24 hours. After infection, cells were incubated with 5 μM NBD-PA (18:1) in medium containing 1% or 10% FBS for 6 hours. Following fixation, parasites were stained with anti-IMC1 and an Alexa Fluor 594-conjugated secondary antibody, and NBD-PA uptake was assessed by fluorescence microscopy. Merged images display NBD-PA fluorescence (green) and parasite staining (red), highlighting lipid uptake across the different strains. Representative images from cells grown in 1% FBS (D) or 10% FBS (E). Scale bar indicates 10 μm. (F) Quantification of NBD-PA from (D&E). Error bars represent mean ± SD from three independent experiments. Statistical analysis was performed using a two-way ANOVA with Dunnett’s multiple comparisons test (*P = 0.03, ***P =0.0004).
Figure 6.
Figure 6.. Lipidomic profiling of WT, Δgra38, and complemented Toxoplasma strains reveals alterations in phosphatidic acid metabolism and lipid composition.
Lipid metabolites were identified by LC/MS based on retention time and mass spectra matched to in-house authentic standards. (A & B) Total lipid abundance in Δgra38 parasites relative to WT (A) and to GRA38WT (B), showing global lipid accumulation upon GRA38 disruption. C) Abundance of individual phosphatidic acid (PA) species in each strain. Values represent peak intensities from three biological replicates. D) Abundance of diacylglycerol (DAG) molecular species in each strain. Values represent peak intensities from three biological replicates. (E) Magnified view of selected DAG species from panel D. (F&G) Abundance of major fatty acid (FA) species, including saturated, monounsaturated (F) and polyunsaturated (G) FAs, comparing Δgra38 to WT and GRA38WT parasites. N=3 biological replicates; data are shown as mean ± SD. *P < 0.05, **P < 0.01, ***P < 0.001, and ****P < 0.0001 by two-way ANOVA followed by Tukey’s multiple comparisons test.
Figure 7.
Figure 7.. Recombinant GRA38–6xHis exhibits PAP activity, which is inhibited by phenylglyoxal and propranolol in a dose-dependent manner.
(A) Schematic representation of phosphatidic acid phosphatase (PAP) catalyzing the hydrolysis of phosphatidic acid (PA) to diacylglycerol (DAG), releasing free inorganic phosphate (Pi). (B-C) Purification of recombinant His-tagged GRA38 and GRA38D72/74A proteins. (B) Coomassie blue-stained SDS-PAGE gel showing purified GRA38–6xHis (117.9 kDa) and GRA38D72/74A-6xHis proteins after Ni-affinity purification from E. coli lysates. (C) Western blot analysis using an anti-His tag antibody confirming the presence of His-tagged GRA38 and GRA38D72/74A. (D) PAP activity assay measuring free phosphate release using a colorimetric malachite green assay. Absorbance was recorded at 620 nm, with background correction using a non-enzyme control containing all reaction components except the enzyme. Phosphate concentrations were determined using a standard curve (0.5–4 nmol potassium phosphate). NEC is No Enzyme Control. Data represent mean ± SD from three independent experiments. Statistical significance was assessed using one-way ANOVA followed by Dunnett’s multiple comparisons test (***P = 0.0007, ****P < 0.0001). (E-F) Dose-dependent inhibition of GRA38 PAP activity by phenylglyoxal and propranolol. Enzyme activity was measured in the presence of increasing inhibitor concentrations (0–4 mM). Absorbance values were corrected for background, and free phosphate release was quantified using the malachite green assay. Phosphate concentrations were determined using a standard curve (0.5–4 nmol potassium phosphate). Data represent mean ± SD from three independent experiments.
Figure 8.
Figure 8.. Δgra38 and ΔDxDxT/V parasites display reduced virulence in mice.
(A) Five CD1 mice were infected intraperitoneally with 100 tachyzoites of WT, Δgra38, GRA38D72/74A, or GRA38WT (all in the RH type I background). The mice were monitored throughout infection, and their weights were recorded. The weight on the day before infection was set to 100%. TData are presented as the average change in body weight for each group. A one-way ANOVA with Tukey’s multiple comparison test was used to evaluate statistical significance (**P = 0.008 at day 10, GRA38WT vs. GRA38D72/74A). (B) Mouse survival was followed for 30 days. Statistical significance was determined by the log-rank (Mantel–Cox) test.

References

    1. Muñoz-Roldan M, Heimesaat MM, Liesenfeld O. Toxoplasmosis. In: Manson’s Tropical Infectious Diseases. Elsevier; 2014. p. 652–63.e1.
    1. Shunmugam S, Arnold CS, Dass S, Katris NJ, Botté CY. The flexibility of Apicomplexa parasites in lipid metabolism. PLoS Pathog. 2022. Mar;18(3):e1010313. - PMC - PubMed
    1. Ramakrishnan S, Serricchio M, Striepen B, Bütikofer P. Lipid synthesis in protozoan parasites: a comparison between kinetoplastids and apicomplexans. Prog Lipid Res. 2013. Oct;52(4):488–512. - PMC - PubMed
    1. Ramakrishnan S, Docampo MD, MacRae JI, Ralton JE, Rupasinghe T, McConville MJ, et al. The intracellular parasite Toxoplasma gondii depends on the synthesis of long-chain and very long-chain unsaturated fatty acids not supplied by the host cell. Mol Microbiol. 2015. Jul;97(1):64–76. - PMC - PubMed
    1. Coppens I. Targeting lipid biosynthesis and salvage in apicomplexan parasites for improved chemotherapies. Nat Rev Microbiol. 2013. Dec;11(12):823–35. - PubMed

Publication types

LinkOut - more resources