[Preprint]. 2025 Apr 15:rs.3.rs-6322956.
doi: 10.21203/rs.3.rs-6322956/v1.

Selecting variant masks to improve power and replicability of gene-level burden tests

Affiliations

Selecting variant masks to improve power and replicability of gene-level burden tests

Trang Nguyen et al. Res Sq. .

Abstract

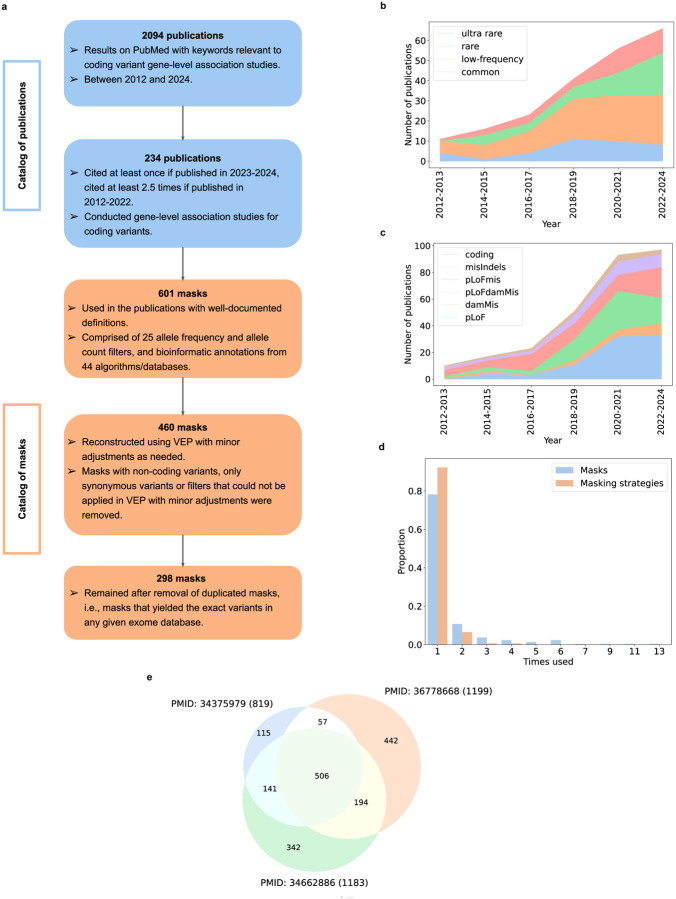
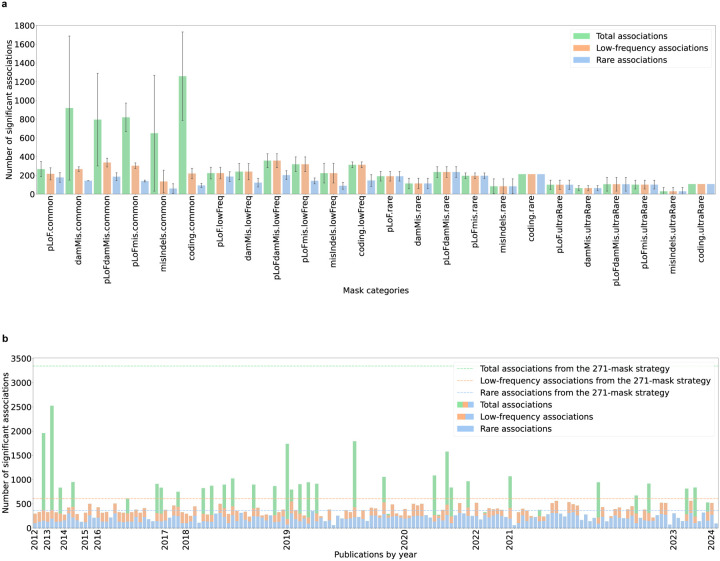
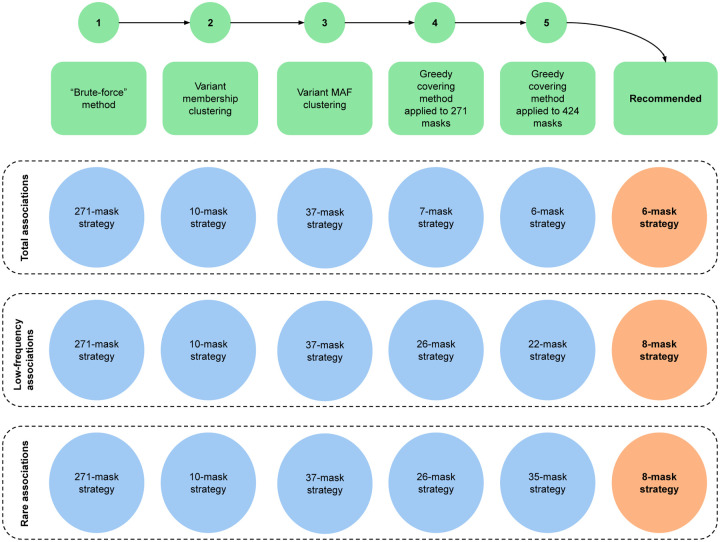
Rare coding variant association studies typically perform gene-level association tests in which variants are filtered (or "masked") and aggregated based on functional annotation and allele frequency. As there is little research and no consensus regarding masking strategies to use, we investigated the impact of masking strategies on gene-level burden tests, the most widely used and interpretable type of aggregate association test. A systematic review of 234 studies catalogued 664 masks and masking strategies that rarely repeated across studies. Analyzing 54 traits within 189,947 UK Biobank exomes, we show that the number of significant associations greatly depends on the masking strategy employed (ranging from 58 to 2,523 associations) and, consequently, separate published analyses of this dataset report minimally overlapping associations (<30%). By empirically determining mask combinations that maximize the number of significant associations, we propose masking strategies that detect twice as many significant low-frequency and rare variant associations as the "average" strategies previously employed, with consistent performance across many traits. Our analyses demonstrate the inconsistency of previously used variant masking strategies and provide a simple solution to increase power and replicability in future studies.


Conflict of interest statement

Competing interest statement P.D. is an employee and stockholder of Regeneron Pharmaceuticals. The remaining authors declare no conflicts of interest relevant to this study.

Figures

Figure 1.
Figure 1.. Summary of previously employed masks and masking strategies.
(a) Summary of the review process of gene-level association studies and mask usage. (b) Number of publications that employed the four maximum minor allele frequency (maxMAF) thresholds over the years (Supplementary Table 3). From top to bottom: ultra rare (red), rare (green), low-frequency (orange), common (blue). (c) Number of publications that employed six types of bioinformatic annotations over the years (Supplementary Table 3). From top to bottom: coding (brown), misIndels (purple), pLoFmis (red), pLoFdamMis (green), damMis (orange), pLoF (blue). (d) Usage frequency of masks and masking strategies after mask harmonization in VEP. (e) Overlap of significant associations between three high-profile studies of the UK Biobank (after Bonferroni correction) for 46 continuous phenotypes: PMID: 34375979 (~470K samples), PMID: 36778668 (~500K samples), and PMID: 34662886 (~455K samples).
Figure 2.
Figure 2.. Number of significant associations for 54 phenotypes across 24 mask categories and 163 publications.
(a) Average number of total (green), low-frequency (orange) and rare (blue) significant associations in 24 mask categories (Supplementary Tables 3, 7a). Error bars represent standard deviations. (b) Number of total (green + orange + blue), low-frequency (orange + blue) and rare (blue) significant associations detected by the masking strategy employed in each publication (Supplementary Table 8). Dashed lines represent the number of total (green), low-frequency (orange) and rare (blue) significant associations produced by the 271-mask strategy.
Figure 3.
Figure 3.. Workflow of analysis to obtain recommended masking strategies.
(1) We considered the 271-mask strategy as a brute-force method. (2) We applied PCA on the binary inclusion of variants in 271 masks and conducted k-means clustering on the first 9 PCs. This resulted in 10 clusters, each of which was “represented” by the mask with the largest number of total, low-frequency or rare significant associations; these masks made up the 10-mask strategies. (3) Among the 10 clusters, PCA and k-means were applied again to variant MAF, dividing the 10 clusters into 37 subclusters. The mask with the largest number of significant associations (total, low-frequency, rare) represented each subcluster, resulting in 37-mask strategies. (4) The greedy covering method iteratively selected the mask with the largest number of additional significant associations after Bonferroni correction for each number of masks out of 271 masks. (5) The greedy covering method was applied to the new set of 424 masks to produce masking strategies with the maximum number of significant associations. All the methods were applied to total associations, low-frequency associations and rare associations separately. Finally, we recommended three masking strategies that consisted of 6 or 8 masks that could detect at least 95% of the maximum number of total, low-frequency or rare significant associations. See Methods for full details.
Figure 4.
Figure 4.. Number of significant associations produced by various masking strategies (after Bonferroni correction for the number of masks).
Green bars represent total associations, orange bars low-frequency associations, blue bars rare associations. Green dashed lines represent total associations, orange dashed lines low-frequency associations, blue dashed lines rare associations by average masking strategies previously employed. Stars represent the number of masks in each masking strategy. The figure shows the number of significant associations produced by (a) best masking strategies previously employed, the brute-forced 271-mask strategy, 37-mask strategies from variant MAF clustering, and 10-mask strategies from variant membership clustering (b) 10-mask strategies from variant membership clustering and optimal masking strategies from 271 masks, (c) optimal masking strategies from 271 masks, optimal masking strategies from 424 masks, and recommended masking strategies. See Supplementary Table 10 and Methods for more details.

References

    1. Kiezun A. et al. Exome sequencing and the genetic basis of complex traits. Nat. Genet. 44, 623–630 (2012). - PMC - PubMed
    1. Lee S., Abecasis G. R., Boehnke M. & Lin X. Rare-Variant Association Analysis: Study Designs and Statistical Tests. Am. J. Hum. Genet. 95, 5 (2014). - PMC - PubMed
    1. Majithia A. R. et al. Rare variants in PPARG with decreased activity in adipocyte differentiation are associated with increased risk of type 2 diabetes. Proc. Natl. Acad. Sci. 111, 13127–13132 (2014). - PMC - PubMed
    1. Wu M. C. et al. Rare-Variant Association Testing for Sequencing Data with the Sequence Kernel Association Test. Am. J. Hum. Genet. 89, 82–93 (2011). - PMC - PubMed
    1. Lee S. et al. Optimal Unified Approach for Rare-Variant Association Testing with Application to Small-Sample Case-Control Whole-Exome Sequencing Studies. Am. J. Hum. Genet. 91, 224 (2012). - PMC - PubMed

Publication types

LinkOut - more resources