[Preprint]. 2025 Apr 15:rs.3.rs-6224399.
doi: 10.21203/rs.3.rs-6224399/v1.

Unraveling the Genetic Blueprint of Doxorubicin-Induced Cardiotoxicity Through Systems Genetics Approaches

Affiliations

Unraveling the Genetic Blueprint of Doxorubicin-Induced Cardiotoxicity Through Systems Genetics Approaches

Buyan-Ochir Orgil et al. Res Sq. .

Update in

Abstract

Background: Anthracycline-induced cardiotoxicity (ACT) is a significant concern for cancer survivors. The genetic basis of ACT remains unclear because of the impact of lifestyle and environmental factors in human studies. This study employs a murine genetic reference population (GRP) of BXD recombinant inbred strains, derived from DBA/2J (D2) and C57BL/6J (B6) crosses, to map quantitative trait loci (QTLs) linked to doxorubicin (DOX)-induced cardiotoxic phenotypes through systems genetics approaches.

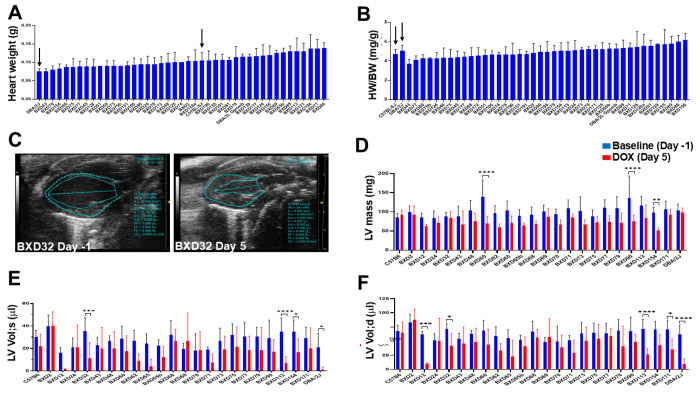
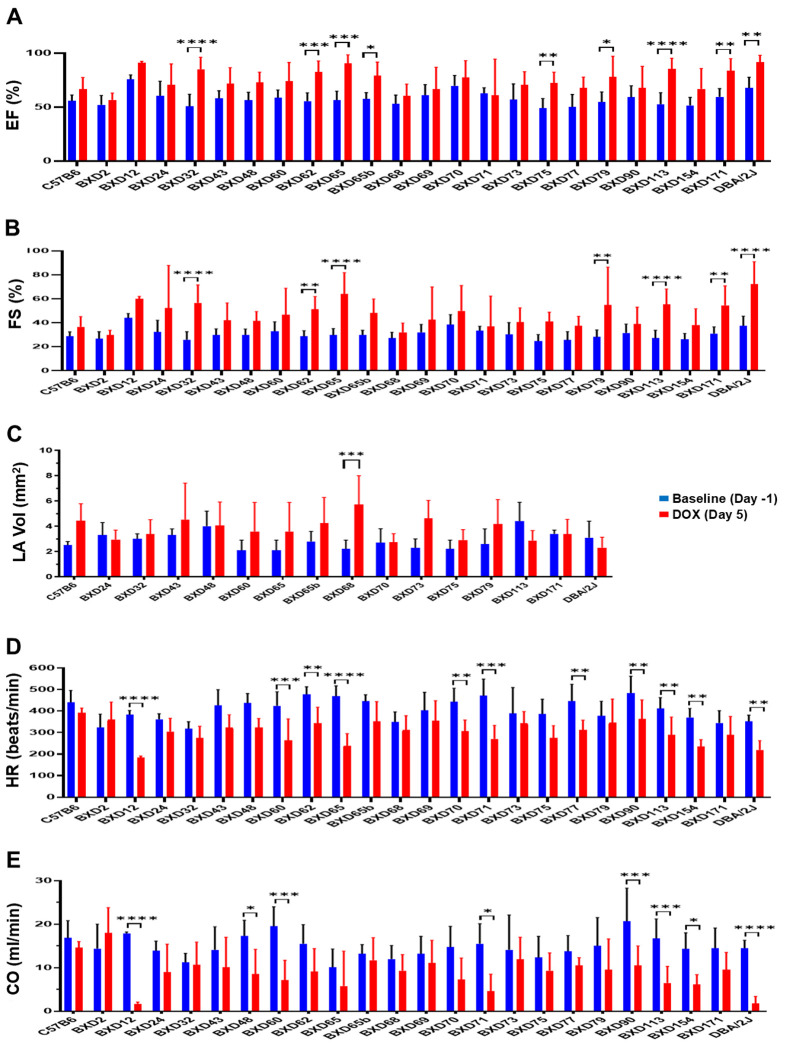
Methods: To model variability in ACT, 58 BXD strains and parental B6 and D2 mice (N ≥ 4 mice/sex, 3-4 months old) underwent an intraperitoneal injection of DOX (20 mg/kg). Survival and body weight (BW) were monitored for 10 days. Echocardiography was performed before treatment and on Day 5 post-treatment. Genetic mapping and Mendelian randomization (MR) analyses were used for identifying QTLs and candidate genes associated with DOX-induced traits and severity.

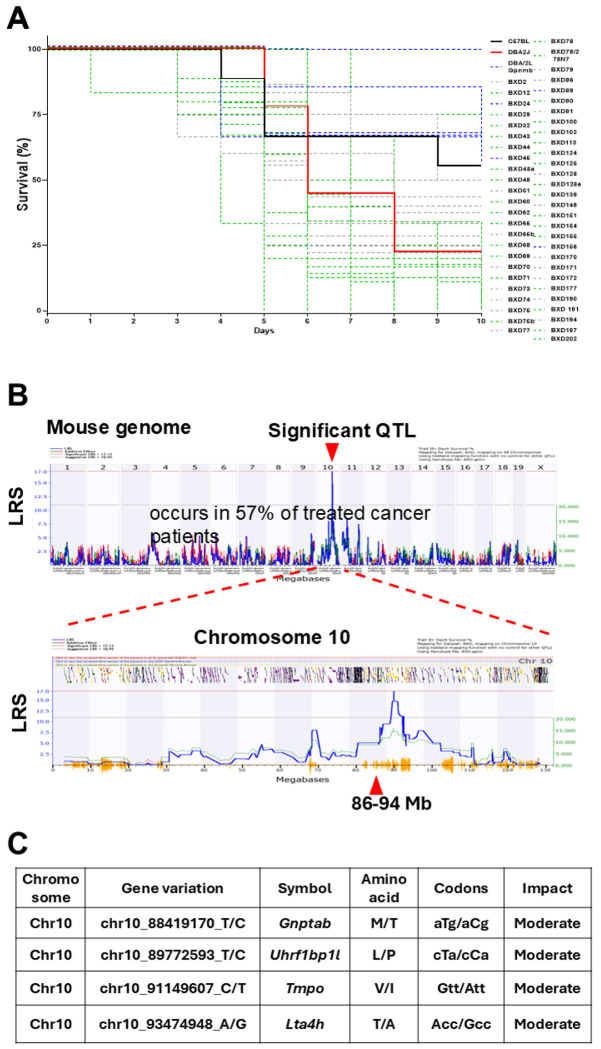
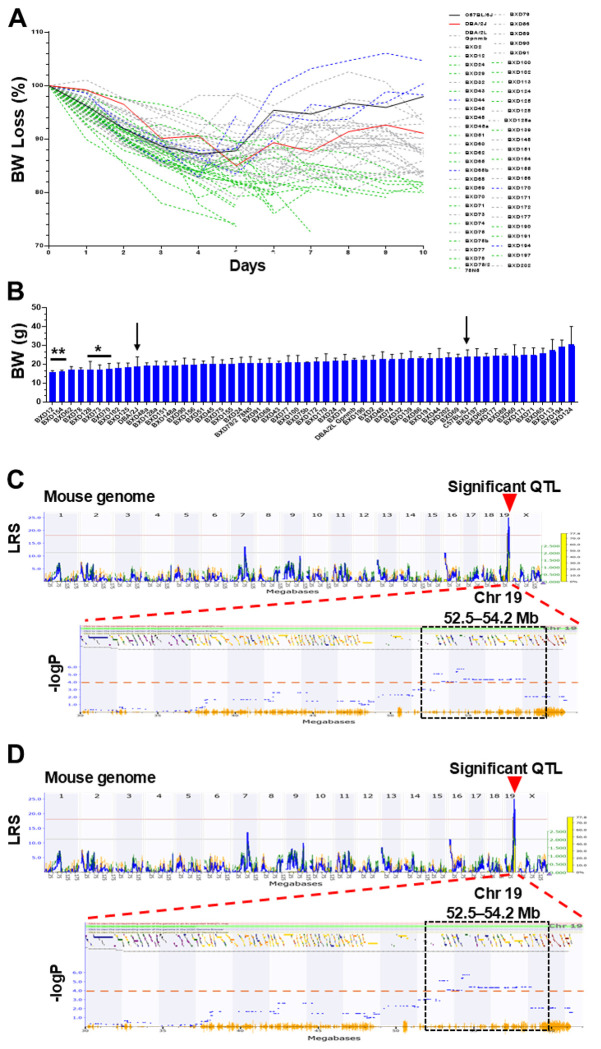
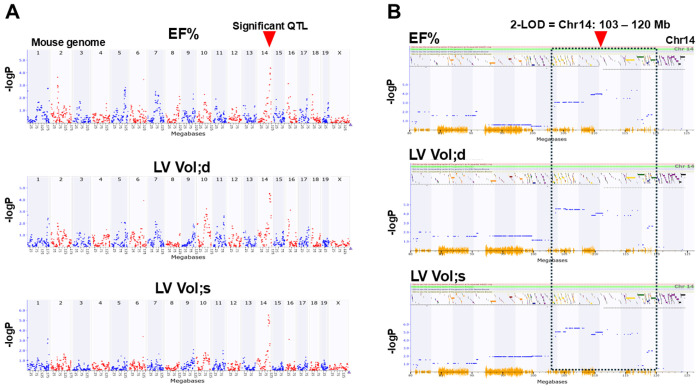
Results: Parental B6 strain had 60% survival, whereas only 24% of D2 mice survived on Day 10. Among BXD strains, median survival varied, with BXD77 showing the lowest at four days. Echocardiography revealed restrictive dysfunction and a small-heart phenotype resembling "Grinch syndrome" observed in ACT patients. Significant QTLs on Chromosome 10 (86-94 Mb), Chromosome 19 (52.5-54.2 Mb) and on Chromosome 14 (103-120 Mb) were associated with the survival, mean BW loss, and left ventricular (LV) volumes and ejection fraction (EF%), respectively. MR analysis identified significant causal associations between the genes implicated in BW loss (ADD3, HSPA12A, SLC18A2, PDZD8, DUSP5, CASP7) as well as EF% and LV volumes (GPC6, UGGT2, SLAIN1, POU4F1, MBNL2) in BXD mice post-DOX and heart failure (HF) outcomes in humans.

Conclusions: Survival, BW loss, and echocardiography parameters considerably varied among DOX-treated BXDs, suggesting significant influence of genetic background on expression of those traits. Several candidate genes that may modulate ACT susceptibility and HF were identified, providing a foundation for genetic-based risk stratification and therapeutics in cardio-oncology.


Conflict of interest statement

Additional Declarations: No competing interests reported.

Figures

Figure 1
Figure 1
The survival rates of BXD mice undergoing DOX treatment and the genetic mapping of these survival rates to the mouse genome. A. The Kaplan-Meier curve illustrates the varying survival rates to DOX (Y-axis, %) among BXD strains. The X-axis represents days after DOX administration. Parental mice, B6 (black line) and D2 (red line), are indicated. The blue dashed lines denote BXD strains with longer survival rates than control B6 mice, while the green dashed lines represent BXD strains with shorter survival than D2 parental mice. B. Manhattan plots display a significant 86-94 megabases (Mb) QTL on Chr10 (arrowhead) associated with survival rates from Day 6 to Day 10 in BXDs treated with DOX. The X-axis represents the chromosomal position in Mb on the mouse genome, while the Y-axis shows the peak LRS (likelihood ratio statistics) score. C. A list of genetic variations in the top candidate genes within the Chr10 QTL identified that have genetic variations among BXD strains.
Figure 2
Figure 2
Rates of body weight (BW) loss in BXDs to DOX treatment and genetic mapping of BW loss to mouse genome. A. Varied rates of mean BW loss in percent (%, Y-axis) among BXDs during 10 days of DOX treatment (X-axis). The BXD strains with significantly higher BW loss (green dashed lines) compared to parental D2 (red line) mice and BXDs with lower BW loss (blue dashed lines) than B6 control mice (black line) are indicated. B. Values of BW in grams (g, Y-axis) on Day 10 post-DOX treatment among BXD mice (X-axis). Arrows indicate parental B6 and D2 mice. Asterisks (*=P<0.05, **=P<0.01) indicate significant differences in BW compared with control B6 strains. C-D. Manhattan plots showing a significant QTL of 52.4-54.2 Mb (arrowhead) on Chr19 associated with the BW loss mean in grams (g, C) and in percent (%, D) in BXDs on Day 10. Y-axis, LRS and -logP scores.
Figure 3
Figure 3
Results of cardiac morphology and echocardiographic assessment in BXDs treated with DOX. A-B.Results of gross heart weight (HW) analysis in BXD mice on Day 10 post-DOX. Y-axis: Values of HW in grams (g, A) and heart weight to body weight (HW/BW, mg/g) ratio in arbitrary units (B) in BXD mice (X-axis). Arrows indicate parental B6 and D2 strains. C.Representative echocardiographic long axis view images of BXD mouse heart at baseline (Day -1) and on Day 5 post-DOX treatment. Left ventricular (LV) walls and chamber length are indicated. D-F. Results of comparative echocardiography assessment at the pre- and post-DOX treatment. Y-axis: Values of LV mass (mg, D), LV volumes (ml) at systole (s, E) and diastole (d, F) among BXDs (X-axis) at the baseline (Day -1, blue columns) compared to Day 5 post-DOX treatment (red columns). Asterisks denote significant differences (*=P<0.05, **=P<0.01, ***=P<0.001, ****=P<0.0001) between Day -1 and Day 5.
Figure 4
Figure 4
Results of echocardiographic assessment of heart function in BXDs treated with DOX. Y-axis: A, ejection fraction (EF%); B, fractional shortening (FS%); C, left atrial (LA) volumes (mm2); D, heart rate (HR, beats/min); E, cardiac output (CO, ml/min) among BXDs (X-axis) at baseline (Day -1, blue columns) compared to Day 5 post-DOX treatment (red columns). Asterisks denote significant differences between Day -1 and Day 5.
Figure 5
Figure 5
Results of GEMMA genetic mapping of echocardiography traits in BXDs in response to DOX. Manhattan plots showing a significant 103-120 Mb QTL (arrowhead): (A) on mouse genome (X-axis); and (B) on Chr14 associated with ejection fraction (EF%) and LV volumes at systole (LV Vol;s) and diastole (LV Vol;d). Y-axis indicates an -logP score.

Similar articles

References

    1. Miller KD, et al. Cancer treatment and survivorship statistics, 2022. CA Cancer J Clin. 2022;72(5):409–36. - PubMed
    1. DeSantis CE, et al. Cancer treatment and survivorship statistics, 2014. CA Cancer J Clin. 2014;64(4):252–71. - PubMed
    1. Lipshultz SE, et al. Long-term cardiovascular toxicity in children, adolescents, and young adults who receive cancer therapy: pathophysiology, course, monitoring, management, prevention, and research directions: a scientific statement from the American Heart Association. Circulation. 2013;128(17):1927–95. - PubMed
    1. Bhatia S. Genetics of Anthracycline Cardiomyopathy in Cancer Survivors: JACC: CardioOncology State-of-the-Art Review. JACC CardioOncol. 2020;2(4):539–52. - PMC - PubMed
    1. Bates JE, et al. Therapy-Related Cardiac Risk in Childhood Cancer Survivors: An Analysis of the Childhood Cancer Survivor Study. J Clin Oncol. 2019;37(13):1090–101. - PMC - PubMed

Publication types

LinkOut - more resources