[Preprint]. 2025 Apr 14:rs.3.rs-5664390.
doi: 10.21203/rs.3.rs-5664390/v1.

An expanded polyglutamine in ATAXIN1 results in a loss-of-function that exacerbates severity of Multiple Sclerosis in an EAE mouse model

Affiliations

An expanded polyglutamine in ATAXIN1 results in a loss-of-function that exacerbates severity of Multiple Sclerosis in an EAE mouse model

Gourango Talukdar et al. Res Sq. .

Update in

Abstract

Background and objectives: Ataxin-1 (ATXN1) is a protein in which expansion of its polyglutamine tract causes the neurodegenerative disorder spinocerebellar ataxia type 1 (SCA1) via a gain-of-function. Wild type ATXN1 was recently shown to have a protective role in regulating severity of experimental autoimmune encephalomyelitis (EAE), a well-established mouse model for Multiple sclerosis (MS). This study further investigates the role of ATXN1 with an expanded polyglutamine tract in the context of MS using an EAE mouse model.

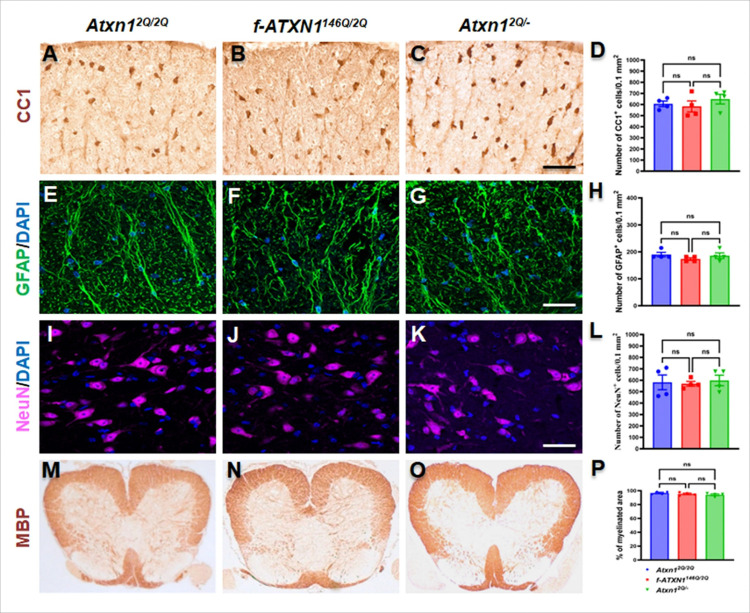
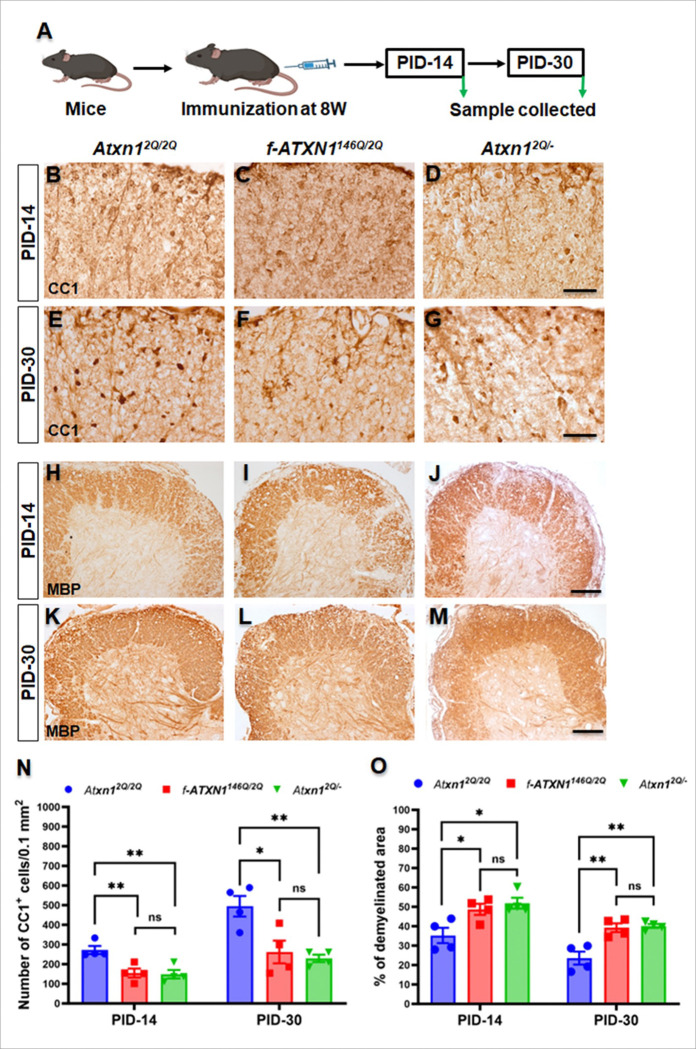
Methods: Hemizygous Atxn1 (Atxn1 2Q/-) mice or f-ATXN1 146Q/2Q , heterozygous mice that have one copy of the endogenous mouse gene replaced with a polyQ expanded pathogenic human ATXN1 gene, were injected with myelin oligodendrocytes glycoprotein (MOG35 - 55) peptide to induce EAE. Immunohistochemical and biochemical approaches were used to analyze the degree of demyelination, cell loss, axonal degeneration as well as detecting the activated immune cells and inflammatory cytokines upon EAE induction in Atxn1 2Q/- and f-ATXN1 146Q/2Q mice.

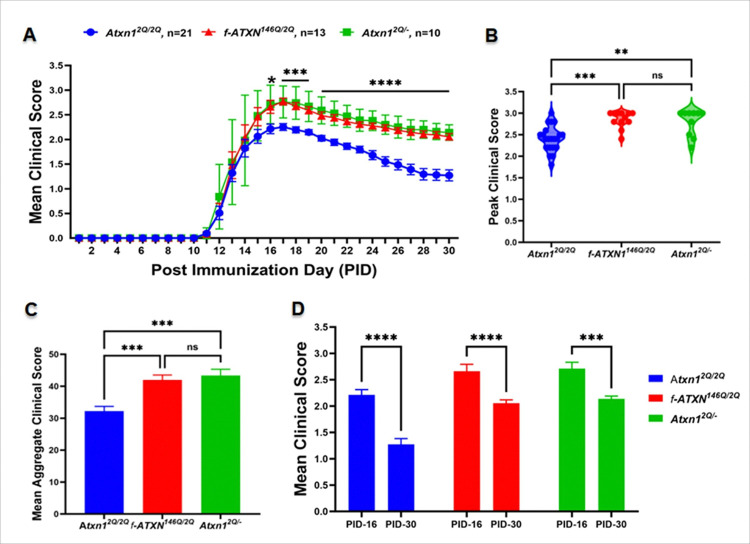
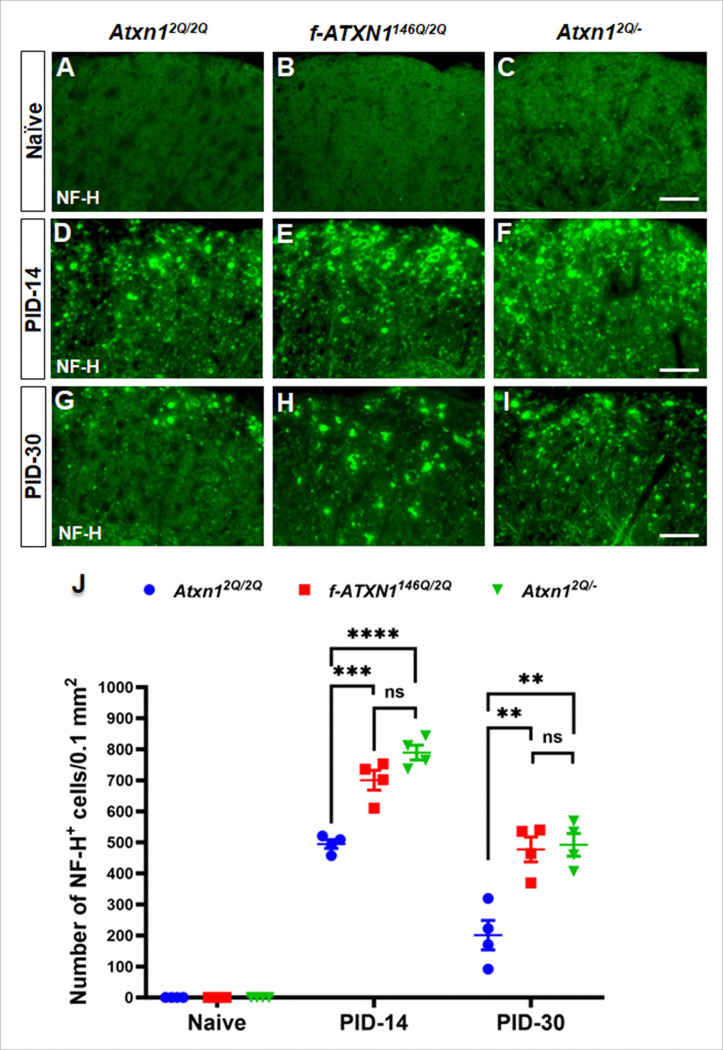
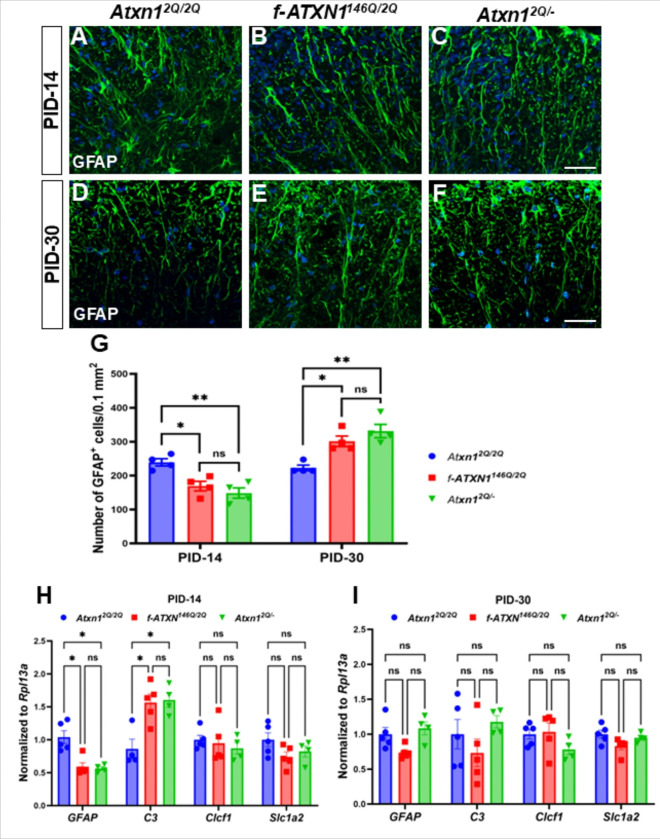
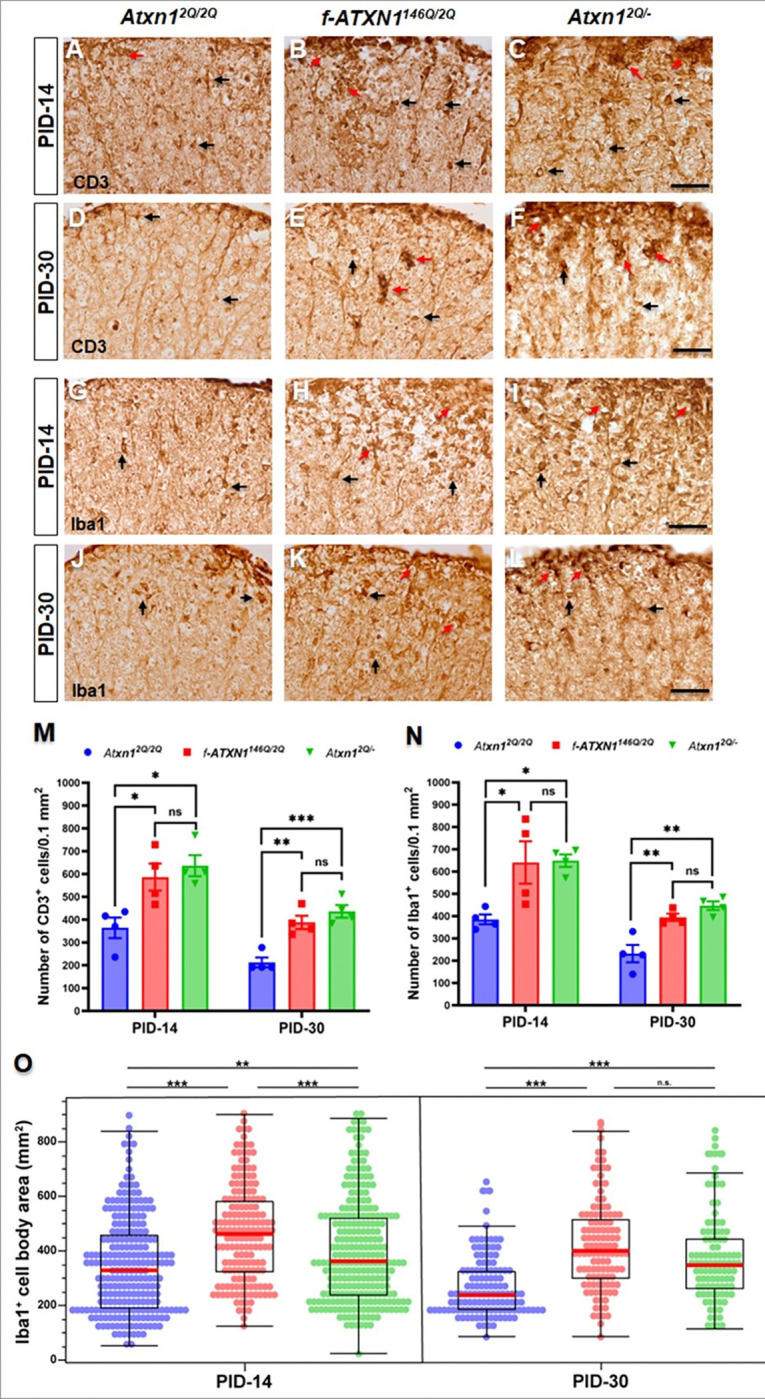
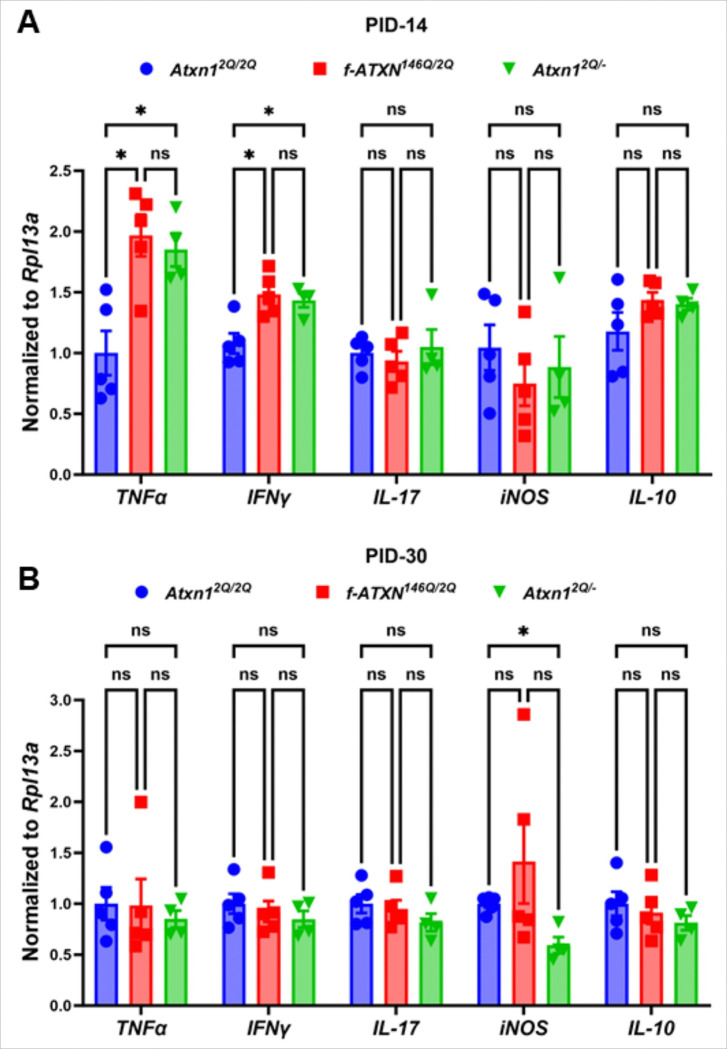
Results: Our findings reveal that a loss-of-function of wild type Atxn1 in Atxn1 2Q/- and f-ATXN1 146Q/2Q mice significantly exacerbates the EAE symptoms, leading to increased demyelination, oligodendrocytes loss, heightened axon degeneration, and greater clinical disability in affected mice. Importantly, the data reveals that neurotoxic astrocytes are activated at acute stage of disease (PID-14) and at the chronic stage of disease (PID-30) neurotoxic astrocytes no longer show signs of activation. The data also demonstrated enhanced infiltration of immune cells into the lesions of mutant mice.

Discussion: These results indicate that ATXN1 plays a protective role in modulating immune responses and maintaining neural integrity during MS. Importantly, expansion of the polyQ tract in ATXN1 results in a loss-of-function in ATXN1's ability to dampen the immune response. Understanding the functional role of ATXN1 in MS pathogenesis may open new avenues for therapeutic strategies aimed at mitigating disease progression.

Keywords: ATAXIN1; EAE; Multiple sclerosis; SCA1; autoimmune; demyelination.


Conflict of interest statement

Conflict of interest: The authors declare no competing financial interests.

Figures

Figure 1
Figure 1
Nerve and glial cell viability and myelination are not altered at the age of 8 weeks in f-ATXN1146Q/2Q and Atxn12Q/ mice. (A–D) CC1 IHC (DAB stain) showed a comparable number of oligodendrocytes in the lumbar spinal cord of WT mice, f-ATXN1146Q/2Q mice, and Atxn12Q/ mice. (E–H) GFAP stain showed no differences in astrocytes (green) number, with nuclear counterstain DAPI (Blue), at the white matter of the lumbar spinal cord among the groups. (I–L) NeuN stain showed similar number of motor neurons (purple), with nuclear counterstain DAPI (Blue), in the grey matter of the lumbar spinal cord among all groups of mice. MBP IHC showed a comparable degree of myelination in lumbar spinal cord of the WT mice, f-ATXN1146Q/2Q and Atxn12Q/ mice (M–P). N = 4 animals each. Scale bars: 40 μm (A–C, E–G, I–K). Statistical analyses were done with a one-way ANOVA with a Tukey’s multiple comparison test. Error bars represent SEM; ns, not significant.
Figure 2
Figure 2
EAE severity is enhanced in f-ATXN1146Q/2Q and Atxn12Q/ mice. (A) Mean EAE clinical scores showed an identical more severe disease course in f-ATXN1146Q/2Q and Atxn12Q/ mice compared to WT control mice. (B) Peak EAE clinical score for individual mice. (C) The mean aggregate EAE clinical score was higher in f-ATXN1146Q/2Q and Atxn12Q/ mice compared to WT control mice. (D) Mean EAE clinical scores PID-16 and PID-30 for WT (N = 21), f-ATXN1146Q/2Q (N = 13), and Atxn12Q/ mice (N = 10). Error bars represent SEM. Differences between scores on each day were assessed by two-way ANOVA with Tukey’s multiple comparison test (A, D) and one-way ANOVA with Tukey’s multiple comparison test (B, C). * (knock-in vs. wildtype; heterozygous vs. wildtype); *p≤ 0.05, **p≤ 0.01, ***p≤ 0.001, ****p≤ 0.0001, ns, not significant.
Figure 3
Figure 3
EAE-induced oligodendrocyte loss and demyelination are more severe in f-ATXN1146Q/2Q and Atxn12Q/ mice. (A) Diagram depicting the sample collection protocol. (B–G, N) DAB staining of the CC1 in the lumbar spinal cord showed significantly higher loss of oligodendrocytes in f-ATXN1146Q/2Q and Atxn12Q/ mice during peak disease at PID-14 (B–D) and during remission at PID-30 (E–G), as with WT mice. There were no differences in the level of oligodendrocyte loss between f-ATXN1146Q/2Q mice and Atxn12Q/ mice at PID-14 and PID-30. (H–M, O) DAB staining of the MBP showed that the percentage of demyelinated area in the lumbar spinal cord was significantly increased in f-ATXN1146Q/2Q mice and Atxn12Q/ mice compared to WT mice at PID-14 (H–J) and PID-30 (K–M). No significant differences in the degree of demyelination in the lumbar spinal cord were observed between f-ATXN1146Q/2Q and Atxn12Q/ mice at PID-14 and PID-30. N = 4 animals each. Scale bars: 40 μm (B–G) and 100 μm (H–M). Statistical analyses were done with one-way ANOVA with Tukey’s multiple comparison test. Error bars represent SEM; *p≤ 0.05, **p≤ 0.01, ns, not significant.
Figure 4
Figure 4
EAE-induced axon degeneration is enhanced in f-ATXN1146Q/2Q and Atxn12Q/ mice. (A–C, J) Immunofluorescence staining of the NF-H for degenerating axons in the lumbar spinal cord showed that no axon degeneration was found in Naïve mice at age of 8 weeks (A–C). (D–F, J) Immunofluorescence staining of NF-H in lumbar spinal cord displayed significantly higher number of degenerating axons in f-ATXN1146Q/2Q and Atxn12Q/ mice during accelerated disease progression at PID-14 (D–F) and during remission at PID-30 (G–I) compared to WT mice. (J) f-ATXN1146Q/2Q and Atxn12Q/ mice showed comparable number of degenerating axons at both time points. N = 4 animals each. Scale bars: 40 μm. Statistical analyses were done with one-way ANOVA with Tukey’s multiple comparison test. Error bars represent SEM; *p≤ 0.05, **p≤ 0.01, ***p≤ 0.001, ****p≤ 0.001, ns, not significant.
Figure 5
Figure 5
Alteration in EAE-induced reactive astrocytes at early and late Post Immunization Days. GFAP immunofluorescence staining (green) and nuclear counterstain, DAPI (blue) showed ablation of reactive astrocytes in the white matter of lumbar spinal cord of f-ATXN1146Q/2Q and Atxn12Q/ mice compare to WT controls in the acute phage of disease progression at PID-14 (A–C, G). In the chronic phage of diseases progression at PID-30 (D–f, G), the elevated number of reactive astrocytes were counted in the white matter of lumbar spinal cord of both f-ATXN1146Q/2Q and Atxn12Q/ mice compared to WT controls. N = 4 animals each. Scale bars: 40 μm. RT-qPCR analysis showing the lower levels of GFAP and higher levels of C3 in the lumbar spinal cord of f-ATXN1146Q/2Q and Atxn12Q/ mice compared to WT controls at PID-14 (H), while levels were comparable among three groups at PID-30 (I). No significant differences of Clcf1 and Slc1a2 expressions were observed in the lumbar spinal cord of WT, f-ATXN1146Q/2Q, and Atxn12Q/ mice at either PID-14 (H) or PID-30 (I). N = 45 animals each. Statistical analyses were done with one-way ANOVA with Tukey’s multiple comparison test. Error bars represent SEM; *p≤ 0.05, **p≤ 0.01, ns, not significant.
Figure 6
Figure 6
Infiltration of inflammatory T cells and macrophages/microglia in the white matter of EAE-induced lumbar spinal cord lesions at early and late Post Immunization Days. (A–F, M) DAB staining of CD3 (T cells) showed higher number of T cells at PID-14 (A–C) as well as at PID-30 (D–F) in the lumbar spinal cord of f-ATXN1146Q/2Q and Atxn12Q/ mice compared to WT controls. No significant differences were seen between the lumbar spinal cord of f-ATXN1146Q/2Q and Atxn12Q/ mice. (G–J, N) DAB staining of Iba1 (macrophages/microglia) showed a higher number of macrophages/microglia at PID-14 (G–I) as well as at PID-30 (J–L) in the lumbar spinal cord of f-ATXN1146Q/2Q and Atxn12Q/ mice compared to WT controls. No significant differences were seen between the lumbar spinal cord of f-ATXN1146Q/2Q and Atxn12Q/ mice. (G–J, O) Morphology analysis showed a higher number of hypertrophic and/or amoeboid macrophages/microglia at PID-14 as well as at PID-30 in the lumbar spinal cord of f-ATXN1146Q/2Q and Atxn12Q/ mice compared to WT controls (O). A significantly higher number of hypertrophic and/or amoeboid macrophages/microglia were observed at PID-14, but their numbers were comparable between the f-ATXN1146Q/2Q and Atxn12Q/ mice at PID-30 (O). N = 4 animals each. Scale bars: 40 μm. Black arrows indicate single cells, and red arrows indicate clusters of activated T cells and macrophages/microglia. Statistical analyses were done with one-way ANOVA with Tukey’s multiple comparison test. Error bars represent SEM; *p≤ 0.05, **p≤ 0.01, ***p≤ 0.001, ns, not significant.
Figure 7
Figure 7
Inflammatory cytokines at the lesion of lumbar spinal cord during EAE. RT-qPCR analysis showing the higher levels of TNFα and IFNγ in the lumbar spinal cord of f-ATXN1146Q/2Q and Atxn12Q/ mice compared to WT controls at PID-14 (A) but comparable at PID-30 (B). No significant differences of TNFα and IFNγ levels were seen between the lumbar spinal cord of f-ATXN1146Q/2Q and Atxn12Q/ mice (A, B). No significant differences of IL-17 and IL-10 levels were seen among the lumbar spinal cord of WT, f-ATXN1146Q/2Q and Atxn12Q/ mice at PID-14 (A) and PID-30 (B). At PID-30, Atxn12Q/ mice showed lower levels of iNOS compared to WT controls, whereas no significant differences were observed among all three groups of mice at PID-14 (A, B). N = 5 animals each. Statistical analyses were done with one-way ANOVA with Tukey’s multiple comparison test. Error bars represent SEM; *p≤ 0.05, ns, not significant.

Similar articles

References

    1. Klement IA, Skinner PJ, Kaytor MD, et al. Ataxin-1 Nuclear Localization and Aggregation: Role in Polyglutamine-Induced Disease in SCA1 Transgenic Mice. - PubMed
    1. Orr HT, Chung M yi, Banfi S, et al. Expansion of an unstable trinucleotide CAG repeat in spinocerebellar ataxia type 1. Nat Genet. 1993;4(3):221–226. doi:10.1038/ng0793-221 - DOI - PubMed
    1. Globas C, Du Montcel ST, Baliko L, et al. Early symptoms in spinocerebellar ataxia type 1, 2, 3, and 6. Movement Disorders. 2008;23(15):2232–2238. doi:10.1002/mds.22288 - DOI - PubMed
    1. Guzman-Martinez L, Maccioni RB, Andrade V, Navarrete LP, Pastor MG, Ramos-Escobar N. Neuroinflammation as a Common Feature of Neurodegenerative Disorders. Front Pharmacol. 2019;10:1008. doi:10.3389/fphar.2019.01008 - DOI - PMC - PubMed
    1. Cvetanovic M, Ingram M, Orr H, Opal P. Early activation of microglia and astrocytes in mouse models of spinocerebellar ataxia type 1. Neuroscience. 2015;289:289–299. doi:10.1016/j.neuroscience.2015.01.003 - DOI - PMC - PubMed

Publication types

LinkOut - more resources