. 2025 Apr 29:20:5573-5591.
doi: 10.2147/IJN.S511506. eCollection 2025.

Nano-Encapsulated Taro Lectin Can Cross an in vitro Blood-Brain Barrier, Induce Apoptosis and Autophagy and Inhibit the Migration of Human U-87 MG Glioblastoma Cells

Affiliations

Nano-Encapsulated Taro Lectin Can Cross an in vitro Blood-Brain Barrier, Induce Apoptosis and Autophagy and Inhibit the Migration of Human U-87 MG Glioblastoma Cells

Raiane Vieira Cardoso et al. Int J Nanomedicine. .

Abstract

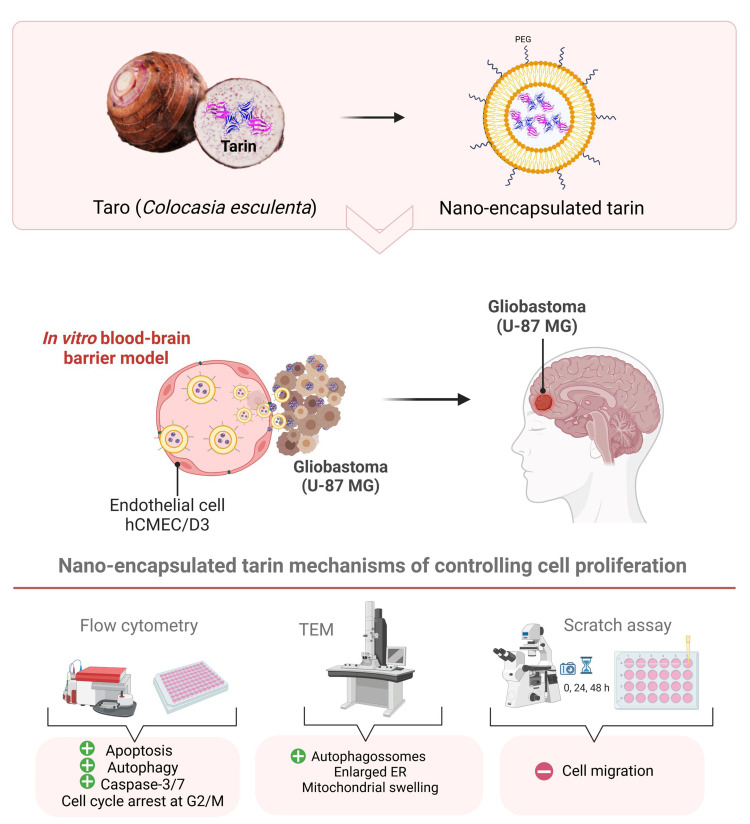
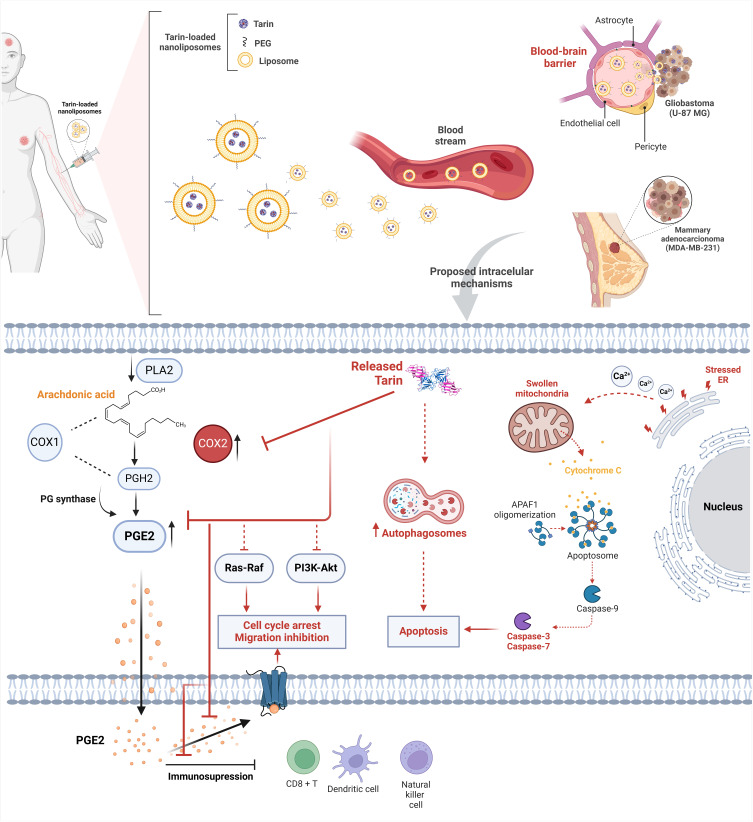
Background: Tarin, purified from taro (Colocasia esculenta), promotes anticancer effect against glioblastoma cells, a heterogeneous and aggressive primary central nervous system tumor and one of the most challenging tumors for oncotherapy. If able to overcome the blood-brain barrier (BBB), tarin may comprise a natural defense against glioblastomas in a context of the development of novel drugs to control these malignant cell proliferations.

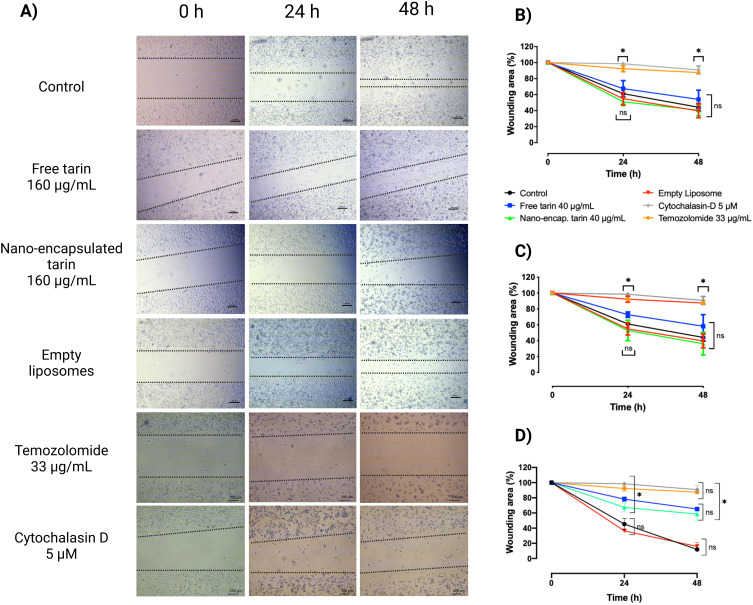
Methods: The anticancer effects of nano-encapsulated tarin were tested against U-87 MG cells and the molecular mechanisms involved in cell proliferation control were assessed by flow cytometry and transmission electron microscopy (TEM) analyses. The scratch assay was performed to investigate cell migration capacity, while nano-encapsulated tarin transport across the BBB was tested on the hCMEC/D3 endothelial cell line.

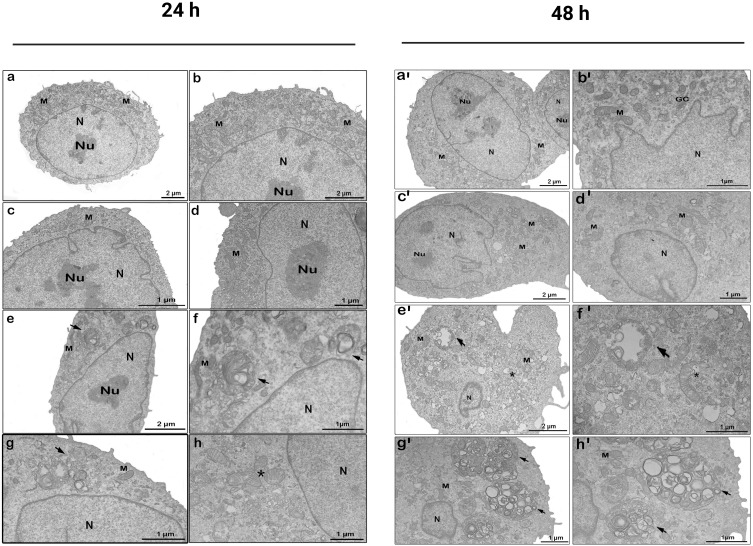
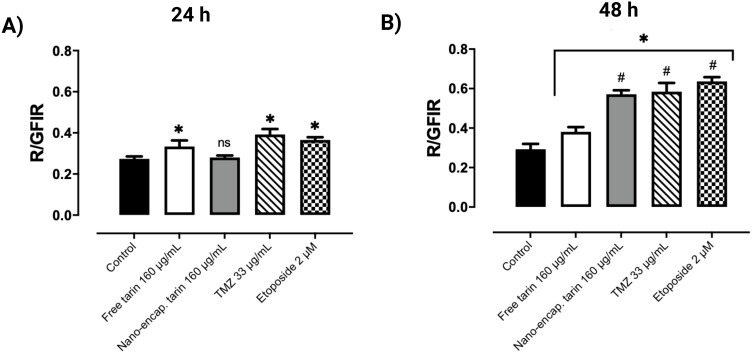
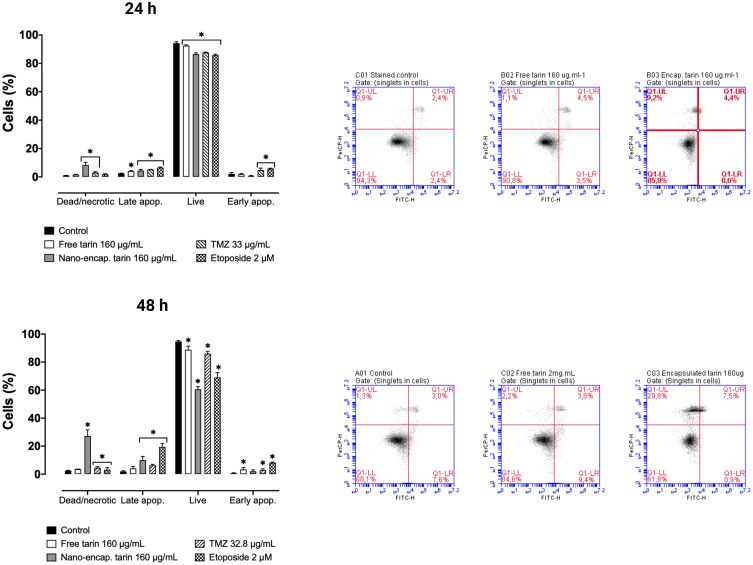
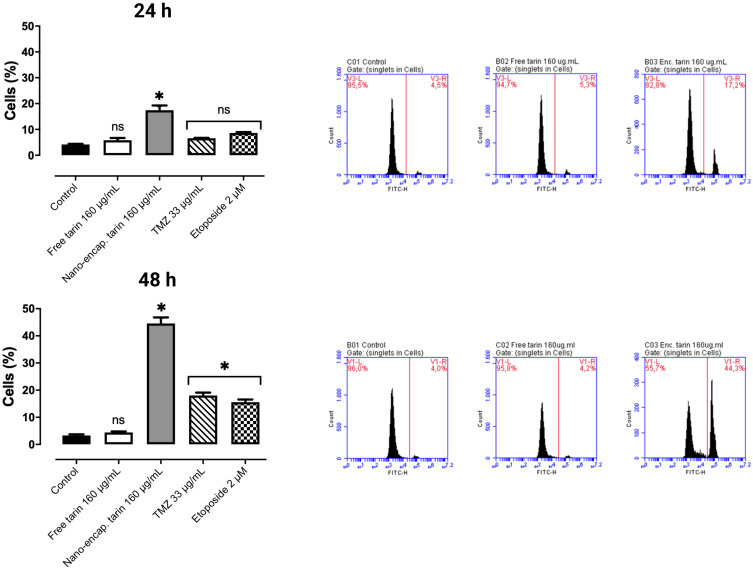
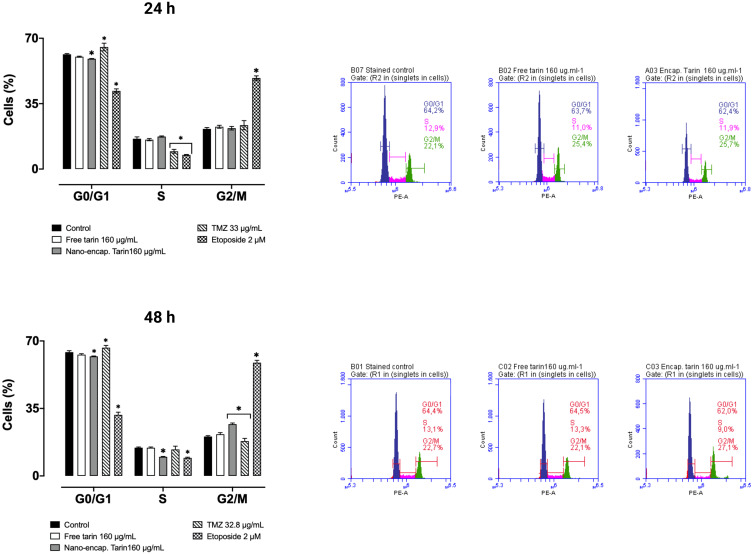
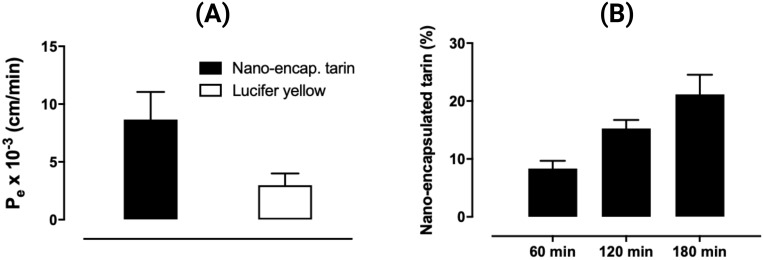
Results: Nano-encapsulated tarin induced autophagy in U-87 MG cells, characterized by the presence of autophagosomes as revealed by TEM and corroborating the flow cytometry analysis employing acridine orange. Additional ultrastructural changes, such as mitochondrial swelling, were also observed. The presence of apoptotic cells and caspase 3/7 activation indicate that nano-encapsulated tarin may also induce cell death through apoptosis. Glioblastoma cell proliferation was arrested in the G2/M cell cycle phase, and cell migration was delayed. Reduced cell proliferation and glioblastoma cell migration inhibition were significant, as tarin was efficiently transported across the BBB during in vitro assays.

Conclusion: Nano-encapsulated tarin may be effectively employed to inhibit glioblastoma cell proliferation and migration, as this novel formulation can overcome the BBB and induces carcinoma cell apoptosis and autophagy. Furthermore, nano-encapsulated tarin may comprise a novel chemotherapeutic agent against different tumoral lines, as it is able to control glioblastoma tumor proliferation by the same molecular mechanisms previously reported for breast adenocarcinomas. Additional studies should be carried out to clarify if nano-encapsulated tarin has a general effect on distinct carcinoma lines.

Keywords: Colocasia esculenta; GNA-related lectin; antitumoral lectin; caspase 3-7 activation; cell cycle arrest; transendothelial permeability.


Conflict of interest statement

The authors report no conflicts of interest in this work.

Figures

None
Graphical abstract
Figure 1
Figure 1
U-87 MG migration following nano-encapsulated tarin treatment over 48 h. (A). Representative photomicrography of the scratch assay depicting U-87 MG cells migration patterns at 0 h, 24 h and 48 h after treatment with nano-encapsulated tarin (160 μg/mL), free tarin (160 μg/mL) or the equivalent volume of empty liposomes, TMZ (33 μg/mL) or cytochalasin D (5 μM). (B) Wound area percentages over time and after challenging the cells with nano-encapsulated tarin at 40 μg/mL, (C) 80 μg/mL and (D) 160 μg/mL. Wound area was calculated using the ImageJ software and considering the initial (0 h) wound area as 100%. Data are presented as means ± SD. *p <0.05, ns- not significant. Scale bars indicate 200 nm.
Figure 2
Figure 2
Ultrastructure of U-87 MG cells treated with nano-encapsulated tarin at 160 μg/mL for up to 48 h evaluated by transmission electron microscopy. Untreated U-87 MG cells (a - b, a’ - b’), cells treated with empty liposomes (c – d, c’ – d’), cells treated with free tarin (160 μg/mL) (e – f, e’ – f’); cells treated with nano-encapsulated tarin (160 μg/mL) (g – h, g’ – h’). Arrows indicate autophagosome formation and multivesicular bodies, *marks mitochondria swelling.
Figure 3
Figure 3
Autophagy induced by free or nano-encapsulated tarin. U-87 MG cells were treated with free or nano-encapsulated tarin (160 μg/mL), TMZ (33 μg/mL), or etoposide (2 μM) for 24 h (A) or 48 h (B). Cells were stained with acridine Orange to reveal acidic vacuolar organelles (AVOs) and data were expressed as the green/red fluorescence intensity ratio (R/GFIR). All experiments were performed in triplicate, where *represents a significant difference compared to the control group, and # in comparison to the same group at 24 h, considering p < 0.05.
Figure 4
Figure 4
Apoptosis assessment in U-87 MG cells challenged with nano-encapsulated tarin. U-87 MG cells exposed to free or nano-encapsulated tarin at 160 μg/mL, TMZ (33 μg/mL) or etoposide (2 μM) for 24 h and 48 h treatments. Percentages of dead/necrotic, early or late apoptotic and live cells were estimated by flow cytometry analyses following annexin V-FITC and PI staining. Percentages are displayed in the left panel while representative dot-plots are shown in the right panel. Quadrant plots display necrotic cells in Q1-UL, late apoptotic cells in Q1-UR, live cells at Q1-LL and early apoptotic cells in Q1-LR.* Indicates significant results compared to control cells, considering p <0.05.
Figure 5
Figure 5
Caspase 3/7 activation in U-87 MG cells treated with nano-encapsulated tarin. U-87 MG cells were exposed to free and nano-encapsulated tarin (160 μg/mL), TMZ (33 μg/mL) or etoposide (2 μM) for 24 h and 48 h. The percentage of cells presenting caspases 3/7 activation was inferred using a fluorogenic tetrapeptide substrate (DEVD) conjugated to a nucleic acid-binding green dye (left panel). Histograms were obtained through a flow cytometer in the FL-1 channel (right panel). Experiments were performed in triplicate, where * represents significant differences compared to the control group with p < 0.05. ns – non-significant. Cells with non-activated caspases are on the VI-L side and those with activated caspases, on the VI-R side.
Figure 6
Figure 6
Effect of nano-encapsulated tarin on the cell cycle profile of U-87 MG cells over 48 h. Cells were challenged for 24 h or 48 h with free or nano-encapsulated tarin (both at 160 μg/mL), TMZ (33 μg/mL) or etoposide (2 mm), followed by PI staining and cell evaluation at every cycle phase by flow cytometry. The percentage of cells in the G0/G1 (dark blue), S (pink) and G2/M(green) phases are presented in bars on the left panel and representative histograms are shown in the right panel. * Indicates significant results compared to control cells, considering p <0.05.
Figure 7
Figure 7
Transendothelial permeability of nano-encapsulated tarin. An in vitro blood-brain barrier was constructed using hCMEC/D3 cells and the transport of nano-encapsulated tarin was monitored over 180 min to determine the permeability coefficient (Pe) (A) and percentage of nano-encapsulated tarin recovered in the bottom chamber of the transwell plate (B). All experiments were conducted in triplicate.
Figure 8
Figure 8
Proposed intracellular mechanisms triggered following the systemic administration of nano-encapsulated tarin in human glioblastoma and breast carcinoma lines. Tarin released from nanoliposomes activates intracellular signalization resulting in cell death by apoptosis by yet unraveled mechanisms. Red lines with line ends indicate previously reported tarin mechanisms, including reduced COX2 gene expression and a consequent decrease in the PGE2-mediated inflammatory response. Dashed red arrows indicate mechanisms already described for GNA-related lectins, but not yet proven for nano-encapsulated tarin. Red text includes the cancer cell effects described herein following treatment with nano-encapsulated tarin, comprising mitochondrial swelling, ER stress, cell cycle arrest, cell migration inhibition, caspase 3/7 activation, autophagosome formation and apoptosis activation. The proposed molecular mechanisms can be applied for both U-87 MG and MDA-MB-231 cells following treatment with nano-encapsulated tarin.

Similar articles

References

    1. Claus EB, Walsh KM, Wiencke JK, et al. Survival and low-grade glioma: the emergence of genetic information. Neurosurg Focus. 2015;38(1):E6. doi:10.3171/2014.10.FOCUS12367 - DOI - PMC - PubMed
    1. Uddin MS, Al Mamun A, Alghamdi BS, et al. Epigenetics of glioblastoma multiforme: from molecular mechanisms to therapeutic approaches. Paper presented at: Seminars in cancer biology. 2022. - PubMed
    1. Lathia JD, Mack SC, Mulkearns-Hubert EE, Valentim CL, Rich JN. Cancer stem cells in glioblastoma. Genes Dev. 2015;29(12):1203–1217. doi:10.1101/gad.261982.115 - DOI - PMC - PubMed
    1. Gimple RC, Bhargava S, Dixit D, Rich JN. Glioblastoma stem cells: lessons from the tumor hierarchy in a lethal cancer. Genes Dev. 2019;33(11–12):591–609. doi:10.1101/gad.324301.119 - DOI - PMC - PubMed
    1. Ohgaki H, Kleihues P. Genetic pathways to primary and secondary glioblastoma. Am J Pathol. 2007;170(5):1445–1453. doi:10.2353/ajpath.2007.070011 - DOI - PMC - PubMed

MeSH terms

Substances

LinkOut - more resources