[Preprint]. 2025 Apr 17:arXiv:2504.13044v1.

The Dissipation Theory of Aging: A Quantitative Analysis Using a Cellular Aging Map

Affiliations

The Dissipation Theory of Aging: A Quantitative Analysis Using a Cellular Aging Map

Farhan Khodaee et al. ArXiv. .

Abstract

We propose a new theory for aging based on dynamical systems and provide a data-driven computational method to quantify the changes at the cellular level. We use ergodic theory to decompose the dynamics of changes during aging and show that aging is fundamentally a dissipative process within biological systems, akin to dynamical systems where dissipation occurs due to non-conservative forces. To quantify the dissipation dynamics, we employ a transformer-based machine learning algorithm to analyze gene expression data, incorporating age as a token to assess how age-related dissipation is reflected in the embedding space. By evaluating the dynamics of gene and age embeddings, we provide a cellular aging map (CAM) and identify patterns indicative of divergence in gene embedding space, nonlinear transitions, and entropy variations during aging for various tissues and cell types. Our results provide a novel perspective on aging as a dissipative process and introduce a computational framework that enables measuring age-related changes with molecular resolution.

Keywords: aging; dissipation; dynamical systems; language modeling; multimodal foundation model; single-cell RNA sequencing.


Figures

Fig. 1
Fig. 1. Overview of theoretical and computational framework
(a) decomposition of aging manifold in time using Hopf decomposition into conservative and dissipative components (b) aggregation of 1528 single-cell RNA-seq dataset encompassing various age groups, tissues, and cell types, (c) modeling of gene expression using a transformer-based model with metadata information and age token, (d) cellular aging map constructed from the output embedding of the model (Created in https://BioRender.com )
Fig. 2
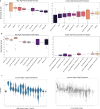
Fig. 2. Construction of aging clock using age prediction from the model
(a) a 10,000 subsample of all healthy tissues (left), healthy samples from respiratory airway tissue (middle), and healthy samples from breast tissue (right), z-scored gap represents the different between model’s prediction and chronological age labels (b) cell-specific age predictions for multiple different cell types with high correlation coefficients that follow chronological age labels, (c) cell types with low correlation coefficient that don’t follow the chronological age labels
Fig. 3
Fig. 3. Similarity analysis reveals tissues that are more susceptible to or are independent of the aging process
(a) Top age-related tissues that have higher dependency to age token (left) and tissues that are not dependent to age token (right), (b) Top age-related cell types with age token (left), and least age-related cell types, (c) Dynamics of changes in aging using z-scored age gap during different stages of lifespan for age groups every 5 years (left), all samples age labels without grouping (right)
Fig. 4
Fig. 4. Embedding-based analysis reveals temporal and tissue-specific gene dynamics across the aging process.
(a) Cosine similarity between gene embeddings and age embeddings across the lifespan highlights tissue-dependent and cell type–specific aging trajectories. Selected genes are shown for blood and lung tissues, as well as macrophages and regulatory T cells, illustrating stage-specific gene relevance from adolescence to late life. (b) Temporal similarity profiles of representative genes in healthy individuals exhibit diverse aging trajectories. (c) Comparison of gene similarity trajectories between healthy and diseased aging for selected genes shows structured, multi-phase relevance during healthy aging and disruption during disease conditions.
Fig. 5
Fig. 5. Metrics of dissipation for aging in various tissues and cell types.
Extracting conservative and dissipative genes based on temporal drift in gene embedding space during aging in (a) healthy and (b) diseased conditions. Entropy analysis for kidney tissue, (c) average entropy changes and (d)changes in entropy distribution during aging. (e) Endothelial cells entropy changes in aging in healthy and diseased samples

Similar articles

References

    1. Lopez-Otin C., Blasco M., Partridge L., Serrano M. & Kroemer G. The hallmarks of aging. Cell. 153, 1194–1217 (2013) - PMC - PubMed
    1. Harman D. Aging: a theory based on free radical and radiation chemistry. Journal Of Gerontology. (1955) - PubMed
    1. Kirkwood T. Understanding the odd science of aging. Cell. 120, 437–447 (2005) - PubMed
    1. Gladyshev V. Aging: progressive decline in fitness due to the rising deleteriome adjusted by genetic, environmental, and stochastic processes. Aging Cell. 15, 594–602 (2016) - PMC - PubMed
    1. Pearl R. The biology of death. (JB Lippincott Company,1922)

Publication types

LinkOut - more resources