. 2025 Mar 31;16(4):1711-1731.
doi: 10.1364/BOE.549311. eCollection 2025 Apr 1.

FLIMB: fluorescence lifetime microendoscopy for metabolic and functional imaging of femoral marrow at subcellular resolution

Affiliations

FLIMB: fluorescence lifetime microendoscopy for metabolic and functional imaging of femoral marrow at subcellular resolution

Alexander F Fiedler et al. Biomed Opt Express. .

Abstract

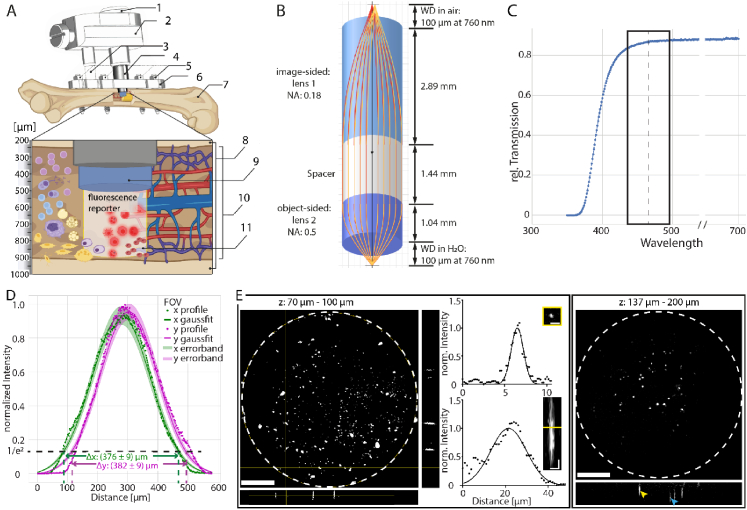
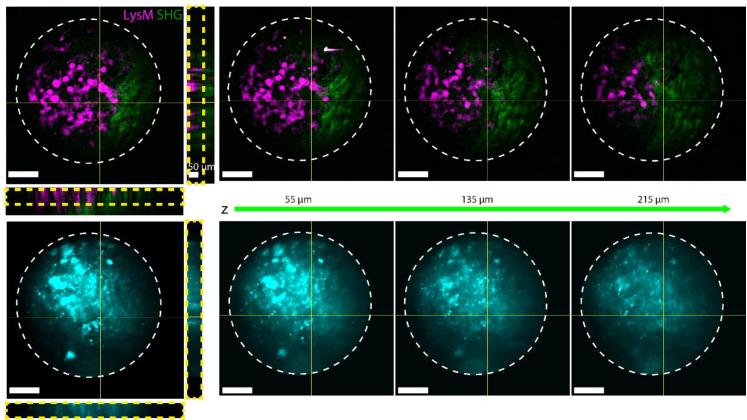
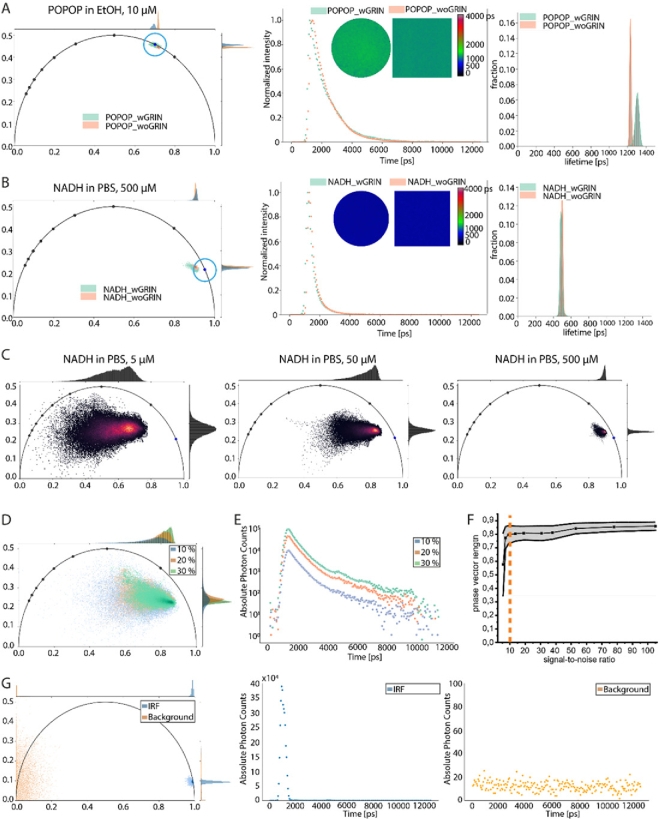
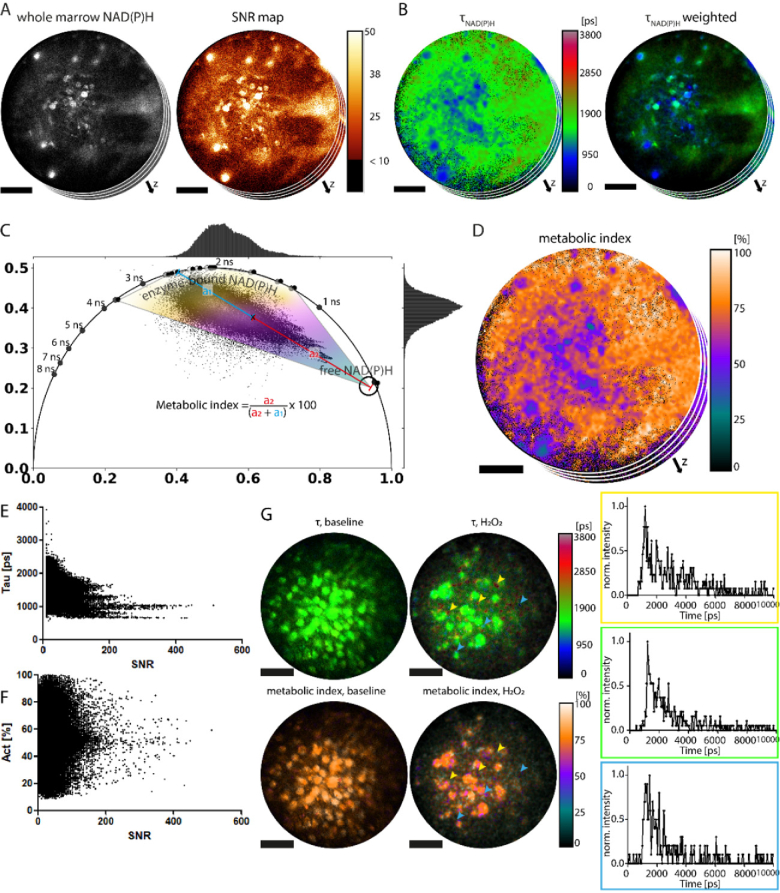
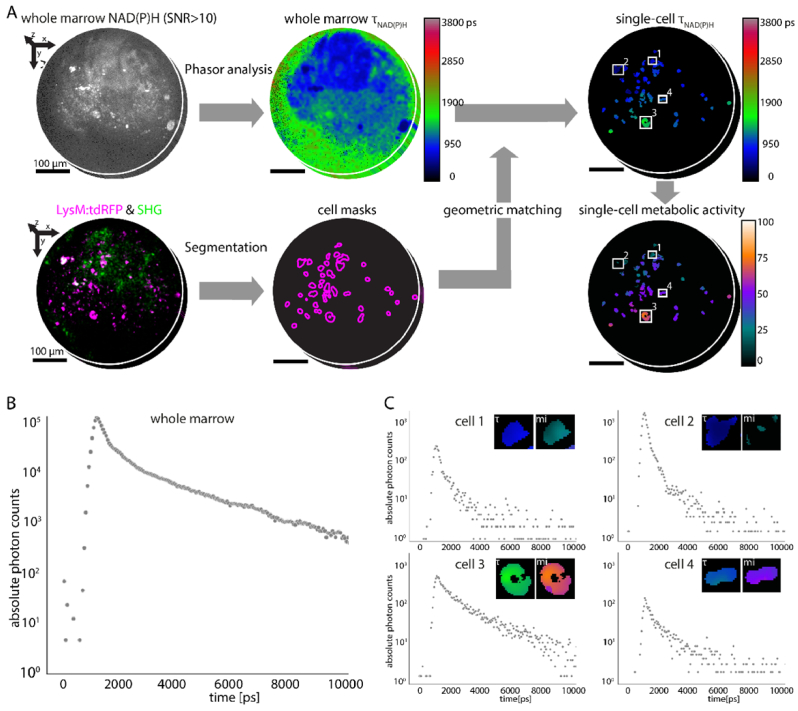
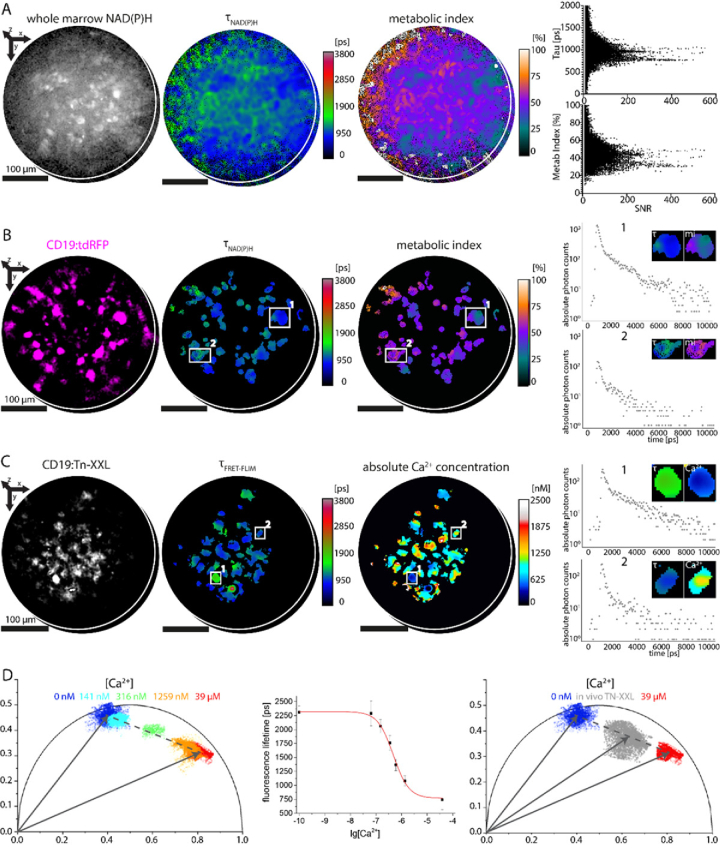
Intravital imaging of bone marrow provides a unique opportunity to study cellular dynamics and their interaction with the tissue microenvironment, which governs cell functions and metabolic profiles. To optically access the deep marrow of long bones, we previously developed a microendoscopy system for longitudinal two-photon fluorescence imaging of the murine femur. However, this does not provide information on cell functions or metabolism, for which quantification fluorescence lifetime imaging (FLIM) has proven to be a versatile tool. We present and characterize FLIMB, an adapted GRIN-based microendoscopic system capable of performing reliable, co-registered TCSPC-based two-photon excited FLIM and fluorescence imaging in the femur of fluorescent reporter mice, at sub-cellular resolution. Using FLIMB, we demonstrate metabolic imaging via NAD(P)H-FLIM and intracellular Ca2+ signaling via FRET-FLIM in immune cell subsets, in the femoral marrow. This method retains the power to study molecular mechanisms underlying various cell functions in tissue context thus providing new insights into bone biology.


Conflict of interest statement

Heribert Stürmer is employed by GRINTech GmbH, Jena, Germany. Romano Matthys and Reto Nützi are with RISystem, Landquart, Switzerland. All other authors declare no conflict of interest.

Figures

Fig. 1.
Fig. 1.
Femoral implant for in vivo fluorescence lifetime GRIN-based microendoscopic imaging in the bone marrow. (A) Schematic representation of the femoral implant and endoscope. The system is rigidly fixed to the murine femur and consists of (1) plug-screw to cover and protect the endoscope, (2) reference plate for alignment with the microscope , (3) positioner to mount the reference plate to the fixator, (4) the endoscope and – tubing used to image through the cortex into the bone marrow, (5) bi-cortical screws that rigidly fix the fixator to the murine femur, (6) fixator plate that hosts the endoscope and fixates the bone after surgery, (7) murine femur (that underwent a drill hole or osteotomy surgery), (8) bone cortex, (9) gradient refractive index (GRIN) lens system, (10) bone marrow cavity, (11) imaging volume covered by the GRIN system. Fluorescent reporter mice are used to label specific cells of interest. (B) Custom cylindrical GRIN lens design (total length: 5.37 mm, diameter: 0.50 mm; NEM-050-10-SP1.144-10-760-DS, GRINTech GmbH, Jena, Germany) for FLIM in the bone marrow. The GRIN consists of two GRIN lenses connected by a spacer to adjust system length. (C) Relative transmission of the GRIN lens material with respect to the wavelength. The black rectangle indicates the detection window for NAD(P)H-FLIM (466 ± 30 nm), NAD(P)H fluorescence emission maximum is indicated by the dashed black line. (D) Field of view of the GRIN system (as shown in b) calculated by the 1/e2 of the intensity distribution of a homogeneous reference sample. (E) Left panel: Image of fluorescent beads (100 nm diameter embedded in agarose, excitation/emission at 505/515 nm) through the GRIN system, together with the axial (xz) and lateral (xy) intensity profiles of a single bead. Determined lateral resolution amounts to 1.04 ± 0.21 µm and axial resolution 14.39 ± 2.65 μm, averaged over 10 beads. The dashed line indicates the circular edge of the GRIN. The position of the orthogonal views is indicated by the yellow lines. The 3D image in the left panel was acquired between 70 to 100 µm depth from the sample-sided GRIN lens surface. The 3D image in the right panel was acquired between 137 and 200 µm depth with respect to the same surface. Yellow and cyan arrow heads indicate xz-projections of two beads in 145 μm (lateral resolution 1.17 μm and axial resolution 14.3 µm) and 180 μm depth (lateral resolution 1.18 µm and axial resolution 13.49 µm), respectively. Scale bar = 100 µm in overview images, if not otherwise indicated, and 5 µm in the single bead image.
Fig. 2.
Fig. 2.
Femoral implant for in vivo fluorescence lifetime GRIN-based microendoscopic imaging in the bone marrow. (F) xy, xz and yz projections of 3D images acquired by FLIMB at 1100 nm excitation in the femoral marrow displaying tdRFP fluorescence (magenta) in myeloid cells and second harmonic generation (SHG) of collagen fibers (green) are shown in the top row. Corresponding, simultaneously acquired NADH/NADPH fluorescence images (cyan) at 760 nm excitation are shown in the bottom row. Exemplary xy-slices at different bone marrow tissue depths (z-axis, green) are shown, with the sample-sided GRIN surface at z = 0 µm. Scale bar = 100 µm.
Fig. 3.
Fig. 3.
Benchmarking FLIM analysis by FLIMB microendoscopy. (A) From left to right, the phasor plot, fluorescence decay curve and fluorescence lifetime histogram showing the fluorescence lifetime of the POPOP reference dye (solved in EtOH, 10 µM, 760 nm excitation wavelength). Data were acquired with (green) and without (orange) the GRIN system used for FLIMB. The small inlays in the decay curve plots show the spatial fluorescence lifetime maps with (round, left) and without (square, right) the GRIN lens. The blue circle on the phase semicircle is centered at the known τ value of POPOP in ethanol. (B) Same as (A) for NADH (solved in PBS, 500 µM, 760 nm excitation wavelength). The blue circle on the phase semicircle is centered at the known τ value of NADH. (C) Phasor plots of NADH (solved in PBS) for three selected concentrations 5, 50 and 500 µM (at 32.8 mW laser power, 760 nm). The kernel density estimation (KDE) distributions of the real and imaginary parts of the phase vector are shown on the axis of the phasor plot. (D) Merged phasor plots of NADH (solved in PBS, 100 µM) for three selected excitation laser powers (21.9 mW, 54.7 mW and 65.6 mW, at 760 nm), with KDE distributions of real and imaginary parts of the phase vector shown. (E) Corresponding fluorescence intensity decay curves to (D) over the entire FOV (∼380 µm diameter). (F) Phase vector length of NADH (solved in PBS, 100 µM) averaged over the image, as a function of SNR, determined by increasing excitation power. Gray shaded areas and black dashed lines indicate the spread of phase vector lengths over an image. The dashed orange line marks an SNR value of 10. (G) Phasor plot of instrument response function (IRF = 207 ps) measured through the GRIN system based on the second harmonics generation of KDP crystals at 930 nm excitation (blue) and of background noise (non-fluorescing media, orange). Corresponding time-resolved signal plots of IRF and background are shown in the right graphs.
Fig. 4.
Fig. 4.
NAD(P)H-FLIM of whole bone marrow tissue using FLIMB. (A) NAD(P)H fluorescence image of the femoral marrow (left), i.e. sum of time-resolved NAD(P)H fluorescence images acquired by FLIMB, and corresponding SNR image (right). (B) Corresponding fluorescence lifetime τ map (left), intensity weighted τ map (right). (C) Corresponding phasor plot with an overlay illustrating the color code used to depict general metabolic index in (D). The black circle indicates free NAD(P)H. (D) Metabolic index map showing in percentage the fractions of enzyme-bound and free NAD(P)H. Images show a representative xy-projection of 3D data. (E,F) Pixel-wise mean NAD(P)H fluorescence lifetime (E) and metabolic index (F) dependence on SNR value for the image in (A,B). (G) Intensity weighted mean NAD(P)H fluorescence lifetime and metabolic index maps of B lymphoma cells (RAMOS cells) using FLIMB, before and after treatment with hydrogen peroxide (10% H2O2). As expected for B cells, H2O2 treatment (right top image) leads to locally longer fluorescence lifetimes as compared to untreated cells (left top image) due to NADPH oxidases activation (indicated by yellow arrow heads) as well as to locally shorter fluorescence lifetime (right top image) and lower metabolic index values (right bottom image), i.e. free NAD(P)H (indicated by cyan arrow heads), associated with cell death. Representative NAD(P)H fluorescence decay curves for areas with long lifetimes (yellow box, NADPH oxidase activation), short lifetimes (cyan box, free NAD(P)H) and lifetimes found in untreated cells (green box) are shown in the graphs. Scale bar = 100 µm.
Fig. 5.
Fig. 5.
Co-registration of myeloid-specific tdRFP fluorescence and NAD(P)H-FLIM for single-cell metabolic imaging in the bone marrow. (A) Analysis pipeline to correlate co-registered myeloid-specific tdRFP fluorescence and NAD(P)H-FLIM data. Summed NAD(P)H fluorescence and fluorescence lifetime images acquired by NAD(P)H-FLIM at 760 nm excitation in a LysM:tdRFP mouse (top row, left) are overlapped with the mask of myeloid cells generated based on the simultaneously acquired tdRFP fluorescence image at 1100 nm excitation. tdRFP fluorescence image and segmented myeloid cell outlines are shown in bottom row, left. By masking fluorescence lifetime images of the whole bone marrow in this way, single cell fluorescence lifetime maps are generated. To generate single-cell metabolic index maps, the same pipeline is applied to metabolic index maps of the whole bone marrow. (B) Fluorescence decay curve of the acquired NAD(P)H signal of the whole bone marrow. (C) Fluorescence decay curves of the acquired NAD(P)H signal of four selected myeloid cells (white rectangles in the lifetime map in (A)). Fluorescence lifetime (τ) and metabolic index (mi) maps of the selected myeloid cells are shown as graph inlays. Scale bar = 100 µm.
Fig. 5.
Fig. 5.
Quantitative analysis of single-cell Ca2+ levels and metabolic index in B cells in bone marrow by FLIMB. (A) From left to right, xy-projections of 3D NAD(P)H fluorescence, fluorescence lifetime and metabolic index images of the whole tissue, acquired by FLIMB in the marrow of a CD19:tdRFP mouse, at 760 nm excitation. Pixel-wise mean NAD(P)H fluorescence lifetime (E) and metabolic index (F) dependence on SNR value for the image shown in (A) are shown in the right graphs. (B) From left to right, corresponding tdRFP fluorescence image acquired at 1100 nm excitation and NAD(P)H fluorescence lifetime and metabolic index images of tdRFP+ B cells. The graphs show exemplary fluorescence decay curves of two B cells (white rectangles) in the fluorescence lifetime map, with lifetime (τ) and metabolic index (mi) maps of the respective cells as inlays. (C) From left to right, xy projections of CFP fluorescence, CFP fluorescence lifetime and absolute Ca2+ concentration 3D images acquired by FLIMB in the marrow of a CD19:TN-XXL mouse at 850 nm excitation. The graphs show exemplary CFP fluorescence decay curves for two B cells (white rectangles in the fluorescence lifetime image), with lifetime (τ) and calcium concentration (Ca2+) maps of the respective cells as inlays.. (D) FRET-FLIM calibration of the TN-XXL construct performed in lysate of CD19:TN-XXL cells at defined Ca2+ concentrations is shown in phasor representation (left graph). Dependence of the cyan fluorescent protein fluorescence lifetime, i.e. donor in the TN-XXL construct, on the Ca2+ concentration from the same data (middle graph). Phasor representation of the in vivo FRET-FLIM measurements in (C) with respect to the unquenched and FRET-quenched (39 µmol/L free Ca2+) measured in CD19:TN-XXL cell lysate (right graph). Scale bar = 100μm.

Similar articles

References

    1. Coste A., Oktay M. H., Condeelis D., et al. , “Intravital Imaging Techniques for Biomedical and Clinical Research,” Cytometry, Part A 97(5), 448 (2020).10.1002/cyto.a.23963 - DOI - PMC - PubMed
    1. Radbruch H., Bremer D., Guenther A. E., et al. , “Ongoing Oxidative Stress Causes Subclinical Neuronal Dysfunction in the Recovery Phase of EAE,” Front. Immunol. 7, 92 (2016).10.3389/fimmu.2016.00092 - DOI - PMC - PubMed
    1. Pasqual G., Chudnovskiy A., Tas A., et al. , “Monitoring T cell-dendritic cell interactions in vivo by intercellular enzymatic labelling,” Nature 553(7689), 496–500 (2018).10.1038/nature25442 - DOI - PMC - PubMed
    1. Itkin T., Gur-Cohen S., Spencer A. P., et al. , “Distinct bone marrow blood vessels differentially regulate haematopoiesis,” Nature 532(7599), 323 (2016).10.1038/nature17624 - DOI - PMC - PubMed
    1. Tokoyoda K., Hauser A. E., Nakayama A., et al. , “Organization of immunological memory by bone marrow stroma,” Nat. Rev. Immunol. 10(3), 193–200 (2010).10.1038/nri2727 - DOI - PubMed

LinkOut - more resources