. 2025 Mar 11;16(4):1371-1391.
doi: 10.1364/BOE.557984. eCollection 2025 Apr 1.

Air-pulse optical coherence elastography: how excitation angle affects mechanical wave propagation

Affiliations

Air-pulse optical coherence elastography: how excitation angle affects mechanical wave propagation

Pengfei Song et al. Biomed Opt Express. .

Abstract

We evaluate the effect of excitation angles on the observation and characterization of surface wave propagations used to derive tissue's mechanical properties in optical coherence tomography (OCT)-based elastography (OCE). Air-pulse stimulation was performed at the center of the sample with excitation angles ranging from oblique (e.g., 70° or 45°) to perpendicular (0°). OCT scanning was conducted radially to record en face mechanical wave propagations in 360°, and the wave features (amplitude, attenuation, group and phase velocities) were calculated in the spatiotemporal or wavenumber-frequency domains. We conducted measurements on isotropic, homogeneous samples (1-1.6% agar phantoms), anisotropic samples (chicken breast), and samples with complex boundaries, coupling media, and stress conditions (ex vivo porcine cornea, intraocular pressure (IOP): 5-20 mmHg). Our findings indicate that mechanical wave velocities are less affected by excitation angles compared to displacement features, demonstrating the robustness of using mechanical waves for elasticity estimations. Agar and chicken breast sample measurements showed that all these metrics (particularly wave velocities) are relatively consistent when excitation angles are smaller than 45°. However, significant disparities were observed in the porcine cornea measurements across different excitation angles (even between 15° and 0°), particularly at high IOP levels (e.g., 20 mmHg). Our findings provide valuable insights for enhancing the accuracy of biomechanical assessments using air-pulse-based or other dynamic OCE approaches. This facilitates the refinement and clinical translation of the OCE technique and could ultimately improve diagnostic and therapeutic applications across various biomedical fields.


Conflict of interest statement

GL, JX and YH: Weiren Meditech Co., Ltd. (C); JQ. and LA: Weiren Meditech Co., Ltd. (E).

Figures

Fig. 1.
Fig. 1.
Three types of air cannula utilized for air-pulse stimulation in OCE. (a) straight-type air cannula; (b) 45°-angled curved air cannula; (c) 90°-angled curved air cannula.
Fig. 2.
Fig. 2.
Experiment set-up. (a) Schematic of the air-pulse OCE system that comprised of microliter air-pulse stimulation and high-resolution phase-sensitive OCT detection. SLD: superluminescent laser diode with a waveband of 1290 ± 40 nm. A linear-wavenumber (k) spectrometer disperses the interference spectrum in the k-domain prior to Fourier transform processing for OCT. (b) Geometry of angled stimulation and radial OCT scanning. Air pulse stimulation was performed at the center of the sample, with the excitation angle ( γ ) defined as the angle between the air pulse and the sample's normal, typically aligned with the optical axis. An angular space of ±18° was reserved for locating the canula tip. The OCT scan was performed in 20 radial directions, from 18° to 342°, with an interval angle of 18°.
Fig. 3.
Fig. 3.
Demonstration of en face surface wave quantification methods in spatial-temporal and wavenumber-frequency domains. Sample: 1.3% agar phantom. (a) Spatial-temporal profile of surface wave propagation in the 180° direction, with peak displacement marked as the wavefront. A window with the width of FWHM (full width at half maximum) for the average wave envelope was used for 2D-FFT for (d). (b, c) Spatial-temporal analysis method: (b) wavefront amplitude decay over distance, and (c) group velocity calculation using linear fitting of the peak displacements ( Vgroup_1 , Eq. (4)). (d–f) Wave propagation analysis in the wavenumber-frequency domain: (d) Normalized real component ( β(ω) ) of the wavenumber ( k˜(ω) ), acquired using 2D-FFT of the windowed wave envelope in (a). Red and green curves indicate the slops of β(ω) for A0 and S0 modes, respectively. (e, f) Dispersion curves (A0, S0) for phase and group velocities, respectively. The A0 curves were used to represent phase velocity ( VPhase(ω) , Eq. (8)) and group velocity ( Vgroup_2 , Eq. (9)). (g) 360° en face wave propagation profile over time. See Visualization 1 in the Supplementary Material. (h) Wavefront map. (i–k) Spatial-temporal analysis results: (i) Amplitude, (j) attenuation, and (k) group velocity 1 in 360° directions. (l–n) Wave propagation analysis in the wavenumber-frequency domain: (l) Frequency-dependent phase velocity for A0 mode, (m) averaged phase velocity for A0 mode, and (n) Averaged group velocity 2 for A0 mode.
Fig. 4.
Fig. 4.
Demonstration of en face wave shape quantifications, including roundness, ellipticity, and fractional anisotropy. ρi : polar distance for the measurement data ( i  = 1, …, 20); θ , a, and b : angle, and lengths of the long and short axes for elliptical fitting.
Fig. 5.
Fig. 5.
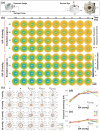
En face surface wave propagation on 1% agar phantoms with excitation angles decreasing from oblique (70°) to perpendicular (0°). Measurements were performed in 360° with radii ranging from 0.93 to 2.80 mm. (a) Selected waveforms for 12 different excitation angles. (b) 360° surface wave feature quantification.
Fig. 6.
Fig. 6.
Quantification results of 360° surface wave propagation for 1%, 1.3%, and 1.6% agar phantoms, with excitation angles ranging from 70° to 0°. (a) Attenuation ( α ) and mechanical wave velocities ( Vgroup_1 , V¯phase , and V¯group_2 ) for different excitation angle groups. (b–d) Quantification of roundness, aspect ratio, and fractional anisotropy for the angular distribution shapes of different mechanical wave metrics, including amplitude ( A ), attenuation ( α ), group velocity 1 ( Vgroup_1 ), averaged phase velocity ( V¯phase ), and averaged group velocity 2 ( V¯group_2 ). Shaded areas represent the mean ± STD of these metrics for the three agar phantoms.
Fig. 7.
Fig. 7.
Surface wave propagation in anisotropic chicken breast samples with fiber orientations: vertical (a), tilted (b), and horizontal (c). Excitation angles were 45°, 30°, and 0°, respectively; radial distance: 0.93–2.80 mm. The selected waveforms and quantification metrics are organized into groups for clarity. FA¯ : Averaged fractional anisotropy.
Fig. 8.
Fig. 8.
En face surface wave quantification on ex vivo porcine cornea. IOP: 5–20 mmHg; excitation angles: 45°–0°; Radial distance: 0.37-1.87 mm. (a) Set-up for porcine cornea measurement. S: superior; I: inferior; N: nasal; T: temporal. (b) Demonstration of the 360° waveforms for 10 mmHg and 20 mmHg groups, respectively. (c) 360° quantification metrics. (d, e) Fractional anisotropy (FA) analysis for Vgroup_1 and V¯phase .
Fig. 9.
Fig. 9.
Comparison of V¯group_1 and V¯phase , and the residual error analysis for oblique to perpendicular tissue excitations for V¯group_1 and V¯phase . Data are derived from V¯group_1 and V¯phase in Figs. 5–8. (a) Direct comparison between V¯group_1 and V¯phase . (b, c) Residual errors (mean vs. difference) for oblique to perpendicular tissue excitations for V¯group_1 and V¯phase , respectively.

Similar articles

References

    1. Guillot C., Lecuit T., “Mechanics of epithelial tissue homeostasis and morphogenesis,” Science 340(6137), 1185–1189 (2013).10.1126/science.1235249 - DOI - PubMed
    1. Wu P. H., Aroush D. R.-B., Asnacios A., et al. , “A comparison of methods to assess cell mechanical properties,” Nat. Methods 15(7), 491–498 (2018).10.1038/s41592-018-0015-1 - DOI - PMC - PubMed
    1. De Lédinghen V., Vergniol J., Barthe C., et al. , “Non-invasive tests for fibrosis and liver stiffness predict 5-year survival of patients chronically infected with hepatitis B virus,” Aliment. Pharmacol. Ther. 37(10), 979–988 (2013).10.1111/apt.12307 - DOI - PubMed
    1. Mahmud A., Feely J., “Arterial stiffness is related to systemic inflammation in essential hypertension,” Hypertension 46(5), 1118–1122 (2005).10.1161/01.HYP.0000185463.27209.b0 - DOI - PubMed
    1. Samani A., Zubovits J., Plewes D., et al. , “Elastic moduli of normal and pathological human breast tissues: an inversion-technique-based investigation of 169 samples,” Phys. Med. Biol. 52(6), 1565–1576 (2007).10.1088/0031-9155/52/6/002 - DOI - PubMed

LinkOut - more resources