. 2025 Apr 8;28(5):112384.
doi: 10.1016/j.isci.2025.112384. eCollection 2025 May 16.

Identification of NUV-244 as a PNPLA3 I148M degrading small molecule

Affiliations

Identification of NUV-244 as a PNPLA3 I148M degrading small molecule

Patrick Steigemann et al. iScience. .

Abstract

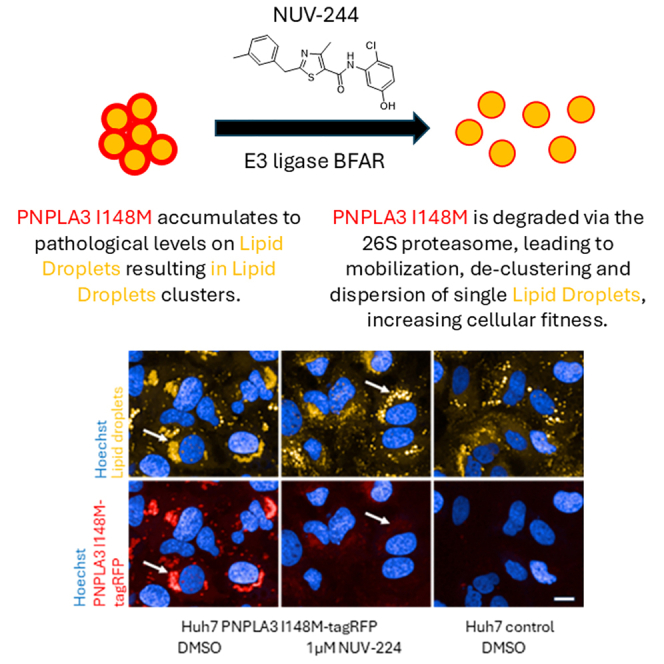
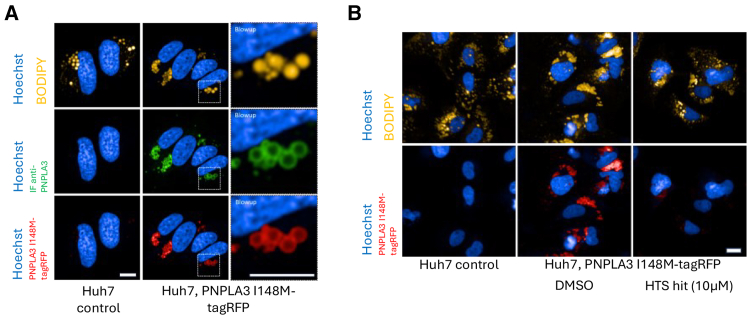
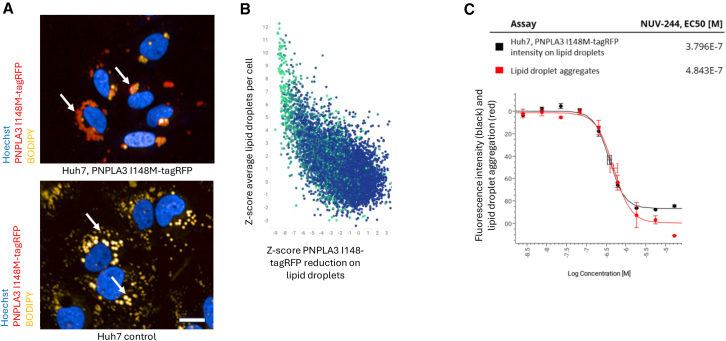
The PNPLA3 I148M variant is a key genetic determinant of metabolic dysfunction-associated steatotic liver disease (MASLD) and related conditions, contributing to lipid metabolism dysregulation and disease progression. To identify small molecules that modulate PNPLA3 I148M, we conducted a high-content screen of over 820,000 compounds and identified NUV-244, a potent degrader of PNPLA3 I148M in liver-derived cells. NUV-244 reduces PNPLA3 I148M levels on lipid droplets via the ubiquitin-proteasome system, involving the E3 ligase BFAR, without affecting PNPLA2. It restores lipid droplet morphology and improves cellular fitness in PNPLA3 I148M-expressing cells. These findings provide a tool to investigate PNPLA3 I148M function and offer a potential strategy for developing targeted therapies for MASLD and related diseases. By enabling selective degradation of PNPLA3 I148M, this approach expands therapeutic possibilities beyond genetic manipulation, addressing a critical need in metabolic liver disease research.

Keywords: Biochemistry; Biological sciences; Cell biology; Functional aspects of cell biology.


Conflict of interest statement

P.S., N.B., V.P., N.Z., K.J., F.V.N., R.L., N.D., D.S., Z.M., F.K., S.S., B.B., and H.S. are or were employees of Nuvisan ICB GmbH, Berlin, Germany. M.H.B., J.S.P., L.B., and F.E.D. are or were employees of Foresite Labs, USA. S.F. and S.R. were consultants for Foresite Labs, USA.

Figures

None
Graphical abstract
Figure 1
Figure 1
HTS for the identification of PNPLA3 I148M modulators (A) Huh7 parental control or Huh7 cells expressing PNPLA3 I148M-tagRFP were stained for PNPLA3 by immunofluorescence. In PNPLA3 I148M expressing cells, PNPLA3 I148M-tagRFP is located on the surface of lipid droplets (yellow channel) as seen by antibody staining against PNPLA3 (green channel) and the PNPLA3 I148M-tagRFP fluorescent signal (red channel). Blowup of cell overview pictures (dotted square) show PNPLA3 I148M-tagRFP being located on the surface of lipid droplets. Hoechst staining in blue. Scale bars ∼10μm. Representative images shown from n > 3 independent experiments. (B) Example pictures from Huh7 parental controls (left, not expressing PNPLA3 I148M-tagRFP) showing lipid droplets and no staining in the RFP channel, DMSO treated control of Huh7 cells expressing PNPLA3 I148M-tagRFP with PNPLA3 I148M-tagRFP co-localized to lipid droplets (middle) and a hit from the HTS showing strong reduction of PNPLA3 I148M-tagRFP on lipid droplets. Scale bar ∼10μm. Representative images shown from n > 3 independent experiments.
Figure 2
Figure 2
NUV-244 properties (A) NUV-244 structure and basic EC50 data. The listed properties were calculated with RDKit [RDKit: Open-source cheminformatics. https://www.rdkit.org] and satisfy Lipinski’s rule of five as well as Veber’s rule., (B) 1μM NUV-244 reduces PNPLA3 I148M-tagRFP from the surface of lipid droplets after 24h incubation (white arrows). Hoechst in blue, lipid droplets in yellow (upper panel). Hoechst in blue, PNPLA3 I148M-tagRFP in red (lower panel). Scale bar ∼10μm. Representative images shown from n > 3 independent experiments. (C) 1μM NUV-244 shows no effect on PNPLA2 staining on lipid droplets. Hoechst in blue, lipid droplets in yellow (upper panel). Hoechst in blue, PNPLA2 in red (lower panel). Blowup of cell overview pictures (dotted square) show PNPLA2 remaining on the surface of lipid droplets after NUV-244 treatment. Scale bar ∼10μm. Representative images shown from n = 2 independent experiments. (D) Dose-response curves for NUV-244 on Huh7 PNPLA3 I148M-tagRFP expressing cells (black curve) and immunofluorescence against PNPLA2 (red curve). Dose-response with n > 3 per concentration. Quantification of signal intensity on lipid droplets. Curves are normalized to DMSO treated PNPLA3 I148M-tagRFP controls (0) and parental Huh7 cells (not expressing PNPLA3, -100) or in case of PNPLA2 immunofluorescence to DMSO treated (0) and secondary antibody controls (−100). Representative data shown from n > 2 independent experiments.
Figure 3
Figure 3
NUV-244 profiling (A) 1.8 μM NUV-244 reduces PNPLA3-tagRFP from the surface of lipid droplets after 24h incubation (white arrows). Hoechst in blue, lipid droplets in yellow (upper panel). Hoechst in blue, PNPLA3-tagRFP in red (lower panel). Scale bar ∼10μm. Representative images shown from n > 3 independent experiments. (B) Dose-response curves for NUV-244 on Huh7 cells either expressing PNPLA3 I148M-tagRFP (black curve) or PNPLA3-tagRFP (red curve). Dose-response with n > 3 per concentration. Curves are normalized to DMSO treated controls (0) and parental Huh7 cells (not expressing PNPLA3, -100). Differences in effect sizes are mainly due to higher total expression levels of PNPLA3 I148M-tagRFP as compared to PNPLA3-tagRFP. Representative data shown from n = 3 independent experiments. (C and D) 1.8 μM NUV-244 reduces untagged PNPLA3 I148M (c.) and PNPLA3 (d.) from the surface of lipid droplets after 24h incubation (white arrows). Hoechst in blue, lipid droplets in yellow (upper panel). Hoechst in blue, Immunofluorescence against PNPLA3 I148M (c.) or PNPLA3 (d.) in red (lower panel). Scale bar ∼10μm. Representative images shown from n > 3 independent experiments. (E) Dose-response curves for NUV-244 on anti-PNPLA3 immunofluorescence quantification of PNPLA3 abundance on lipid droplets in Huh7 cells either expressing PNPLA3 I148M (black curve) or PNPLA3 (red curve). Dose-response with n > 3 per concentration. Curves are normalized to DMSO treated PNPLA3 I148M expressing or PNPLA3 expressing controls (0) and parental Huh7 cells (not expressing PNPLA3, -100). Differences in effect sizes are mainly due to higher total expression levels of PNPLA3 I148M as compared to PNPLA3. Representative data shown from n = 3 independent experiments. (F) Dose-response curves for NUV-244 on Huh7 cells either expressing PNPLA3 I148M-HiBiT (black curve) or PNPLA3-HiBiT (red curve). HiBiT quantification of total protein levels. Dose-response with n > 3 per concentration. Curves are normalized to DMSO treated PNPLA3 I148M-HiBiT expressing or PNPLA3-HiBiT expressing controls (0) and parental Huh7 cells (not expressing PNPLA3, -100). Differences in effect sizes are mainly due to higher total expression levels of PNPLA3 I148M-HiBiT as compared to PNPLA3-HiBiT. Representative data shown from n = 3 independent experiments.
Figure 4
Figure 4
NUV-244 leads to increase in lipid droplet numbers (A) In contrast to Huh7 parental cells (lower picture), lipid droplets are clustered around the nucleus in cells expressing PNPLA3 I148M-tagRFP (white arrows in upper picture). Hoechst in blue, PNPLA3 I148M-tagRFP in red, lipid droplets in yellow. Scale bar ∼10μm. Representative images shown from n > 3 independent experiments. (B) HTS hits at retest (5μM concentration) stage showing scatterplot with the relationship of HTS hits leading to PNPLA3 I148M-tagRFP reduction on lipid droplets (X axis) and lipid droplet count in the same cells. Greener color (color coded for Z score on HiBiT level reduction: blue low/no activity, green higher activity) indicates higher activity in the Huh7 PNPLA3 I148M-HiBiT assay, showing that small molecule-induced reduction in PNPLA3 I148M levels is frequently linked to a decrease in total PNPLA3 I148M protein. (C) EC50 values of NUV-244 (resynthesis) for reduction of PNPLA3 I148M-tagRFP (black curve) on lipid droplets and the normalization of lipid droplet morphology (reduction in lipid droplet aggregates, red curve). Dose-response curves normalized to DMSO treated Huh7 (PNPLA3 I148M-tagRFP) (0) and parental Huh7 (−100) controls. Dose-response with n > 3 per concentration. Representative data shown from n = 3 independent experiments.
Figure 5
Figure 5
NUV-244 mediated degradation of PNPLA3 I148M-tagRFP occurs through the 26S proteasome and involves the E3 ligase BFAR (A) Huh7 cells expressing PNPLA3 I148M-tagRFP were treated with DMSO, 1μM or 5μM NUV-244 and co-treated either with DMSO or 1μM Bortezomib or 5μM MLN7243 and subjected to time-lapse imaging for 20h with one image taken every 15 min. Pictures are stills from timelapse quantified in b. at timepoint t = 0h and t = 10h. Scale bar ∼10μm. Representative images shown from n = 2 independent experiments. (B) Quantification of PNPLA3 I148M-tagRFP on lipid droplets shows rapid decrease in PNPLA3 I148M-tagRFP intensity on lipid droplets following treatment of 1μM or 5μM NUV-244 in cells (black and gray curves) and rescue of degradation after 1μM Bortezomib (red curves) or 5μM MLN7243 (blue curves) co-treatment but not with 5μM MLN4929 (green curves). All values are background corrected tagRFP intensity measurements on lipid droplets normalized to DMSO control and t = 0. n = 9 per condition. Mean and standard deviation (error bars); two independent experiments with comparable results. (C) Huh7 cells expressing PNPLA3 I148M-tagRFP were treated with non-targeting control (left) or BFAR siRNA (right) for 48h, treated with DMSO, 1μM or 5μM NUV-244 and subjected to time-lapse imaging for 20h with one image taken every 15 min. Pictures are stills from 1μM NUV-244 treated cells from timelapse quantified in d. at timepoint t = 0h and t = 10h. Scale bar ∼10μm. Representative images shown from n = 2 independent experiments. (D) Quantification of PNPLA3 I148M-tagRFP on lipid droplets shows rapid decrease in PNPLA3 I148M-tagRFP intensity on lipid droplets following treatment of 1μM or 5μM NUV-244 in cells treated with non-targeting control siRNA (black and gray curves) and a rescue of degradation after BFAR knockdown (red curves). tagRFP intensity measurements on lipid droplets normalized to DMSO control and t = 0. n = 9 per condition. Mean and standard deviation (error bars); two independent experiments with comparable results.
Figure 6
Figure 6
NUV-244 does not affect proliferative fitness in liver cells and restores proliferative fitness in PNPLA3 I148M expressing cells (A) Growth curves of Huh7, Hep3B and LX-2 cells were measured in Incucyte. NUV-244 at 5μM (red curves) shows no signs of toxicity compared to DMSO treated controls (black curves). Similar data was obtained with 1μM NUV-244 (data not shown). n = 16 per condition. Mean and standard deviation (error bars); two independent experiments with comparable results. (B) Expression of PNPLA3 I148M in Huh7 cells reduces proliferative fitness (black curve) compared to non-expressing parental control cells (red curve). Treatment with 5μM NUV-244 leads to restoration of cellular proliferative fitness (blue curve; similar data with 1μM NUV-244). n = 16 per condition. Mean and standard deviation (error bars); two independent experiments with comparable results. Highly significant (adjusted p value < 0.0001) differences in proliferation can be seen in Huh7 expressing PNPLA3 I148M treated with NUV-244 compared to DMSO control from 100h incubation onward (two-way ANOVA, not shown).

References

    1. Romeo S., Kozlitina J., Xing C., Pertsemlidis A., Cox D., Pennacchio L.A., Boerwinkle E., Cohen J.C., Hobbs H.H. Genetic variation in PNPLA3 confers susceptibility to nonalcoholic fatty liver disease. Nat. Genet. 2008;40:1461–1465. - PMC - PubMed
    1. Li Y., Xing C., Cohen J.C., Hobbs H.H. Genetic variant in PNPLA3 is associated with nonalcoholic fatty liver disease in China. Hepatology. 2012;55:327–328. - PMC - PubMed
    1. Cherubini A., Ostadreza M., Jamialahmadi O., Pelusi S., Rrapaj E., Casirati E., Passignani G., Norouziesfahani M., Sinopoli E., Baselli G., et al. Interaction between estrogen receptor-α and PNPLA3 p.I148M variant drives fatty liver disease susceptibility in women. Nat. Med. 2023;29:2643–2655. - PMC - PubMed
    1. Romeo S., Sanyal A., Valenti L. Leveraging Human Genetics to Identify Potential New Treatments for Fatty Liver Disease. Cell Metab. 2020;31:35–45. - PubMed
    1. Li J.Z., Huang Y., Karaman R., Ivanova P.T., Brown H.A., Roddy T., Castro-Perez J., Cohen J.C., Hobbs H.H. Chronic overexpression of PNPLA3I148M in mouse liver causes hepatic steatosis. J. Clin. Investig. 2012;122:4130–4144. - PMC - PubMed

LinkOut - more resources