. 2025 Apr 29:18:5791-5809.
doi: 10.2147/JIR.S492814. eCollection 2025.

Thymosin β4 Regulates Tissue Inflammatory Response in Mouse Nonalcoholic Fatty Liver Disease by Promoting Macrophage M2-Type Polarization

Affiliations

Thymosin β4 Regulates Tissue Inflammatory Response in Mouse Nonalcoholic Fatty Liver Disease by Promoting Macrophage M2-Type Polarization

Zixin Zhu et al. J Inflamm Res. .

Abstract

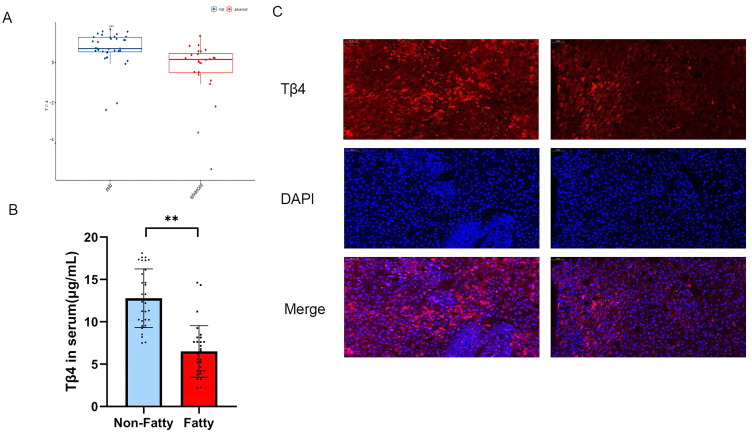
Introduction: Nonalcoholic fatty liver disease (NAFLD) is characterized by hepatic steatosis, insulin resistance, and systemic pro-inflammatory response. Thymosin β4 (Tβ4) is a bioactive polypeptide that inhibits extracellular matrix (ECM) deposition and protects the liver. It can achieve immune homeostasis by regulating the polarization of liver macrophages and is a potential treatment for NAFLD.

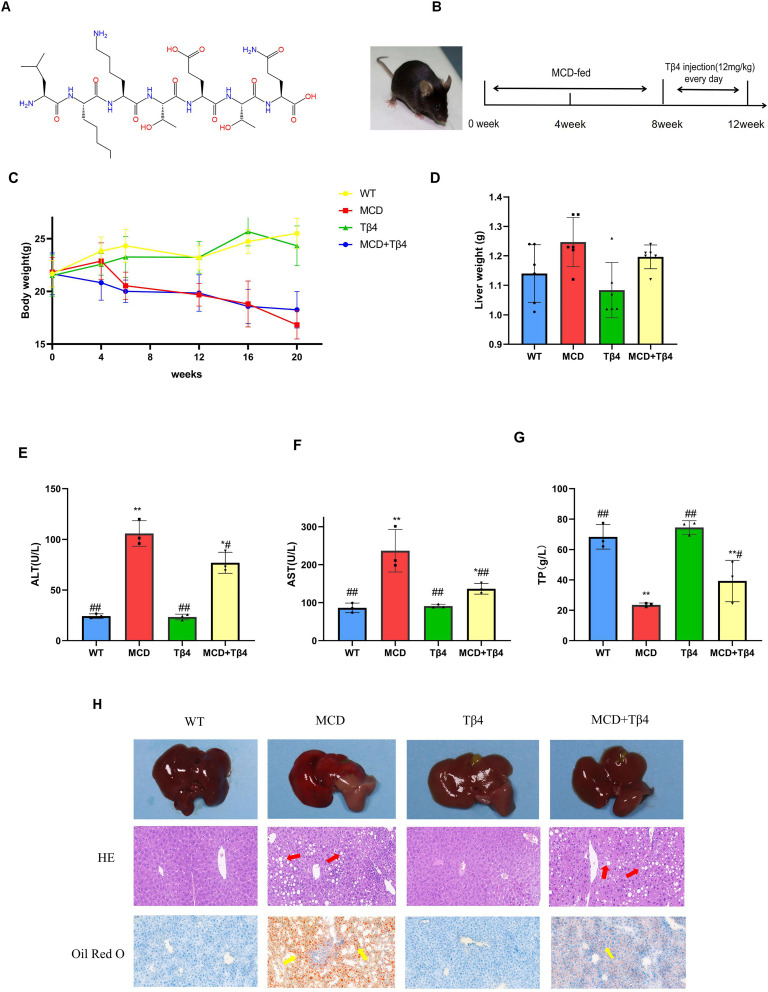
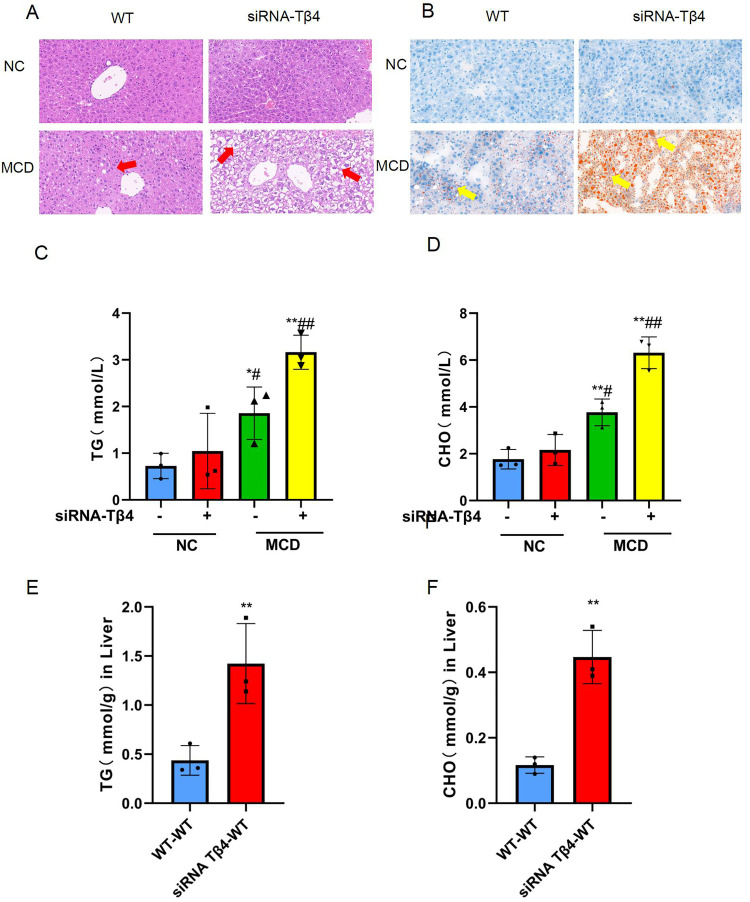
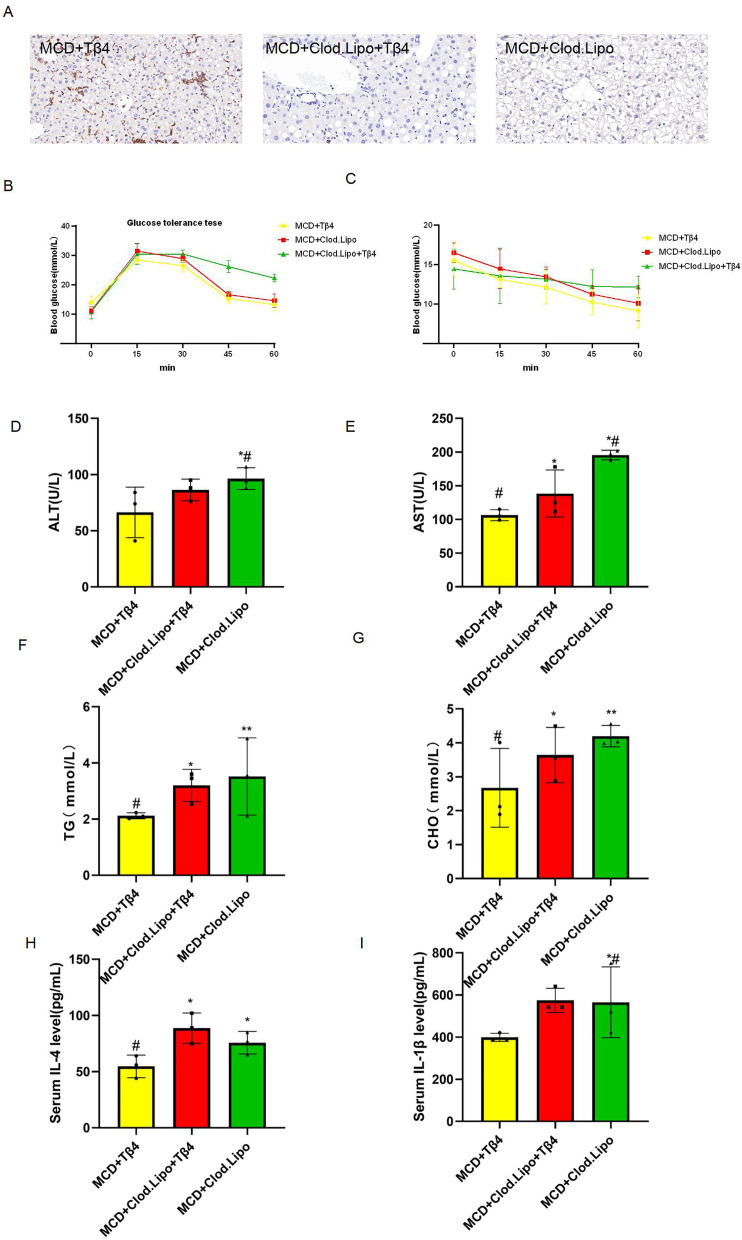
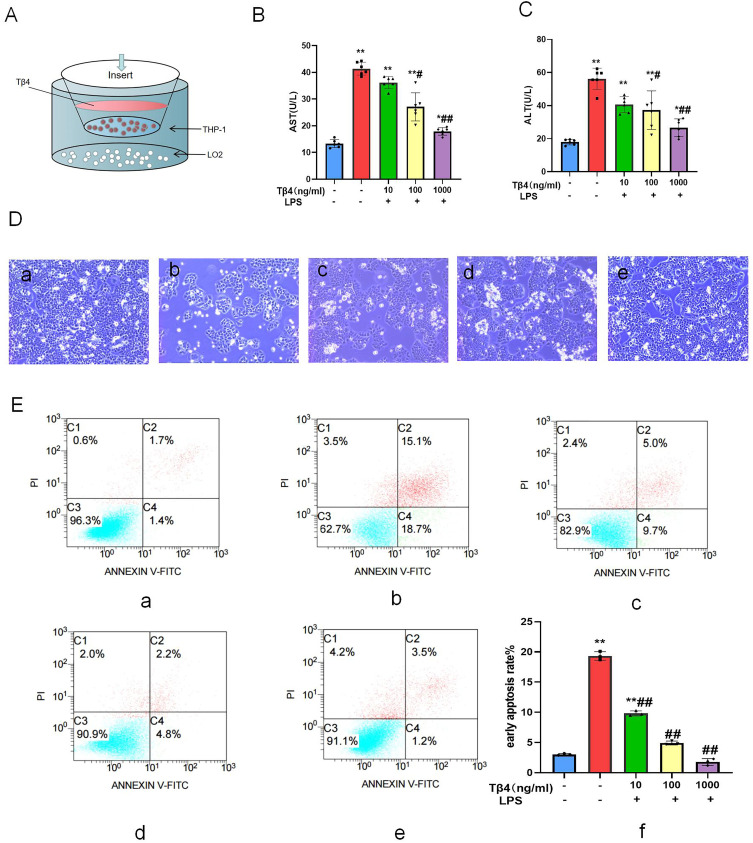
Methods: A dataset was used to evaluate the expression of Tβ4 in fatty and non-fatty adjacent tissues of primary hepatocellular carcinoma. NAFLD was induced in C57 mice with methionine and choline-deficient diet (MCD), siRNATβ4 was injected into the tail vein to reduce liver Tβ4, and the therapeutic effect of Tβ4 was observed by phagocytosis of macrophages with clodronate liposomes. Hematoxylin and Eosin staining (HE) staining was used to observe the inflammation of mice in each group, and oil red O staining was used to determine the lipid accumulation. Macrophage polarization was detected by immunofluorescence assay. In the extrachromosomal experiment of oil red O, human myeloid leukemia mononuclear (THP-1) cells was co-cultured with human hepatic (LO2) constructed with oleic acid to detect the changes of aspartate transaminase (AST) and alanine transaminase (ALT) in supernatant and the apoptosis of LO2 under the intervention of different concentrations of Tβ4.

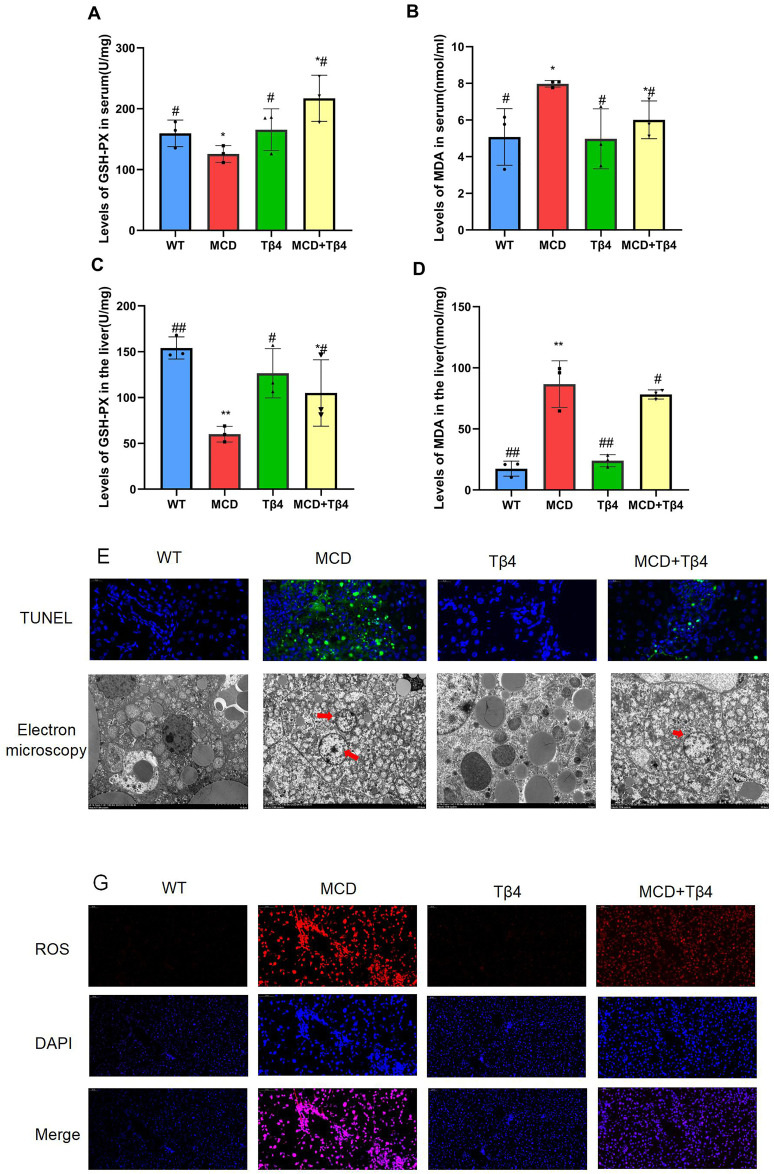
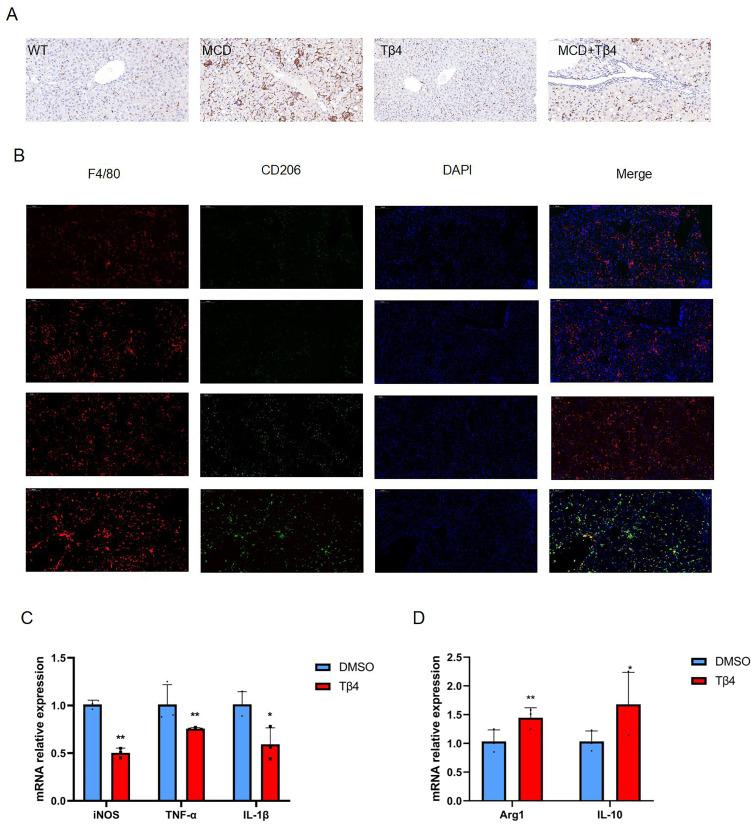
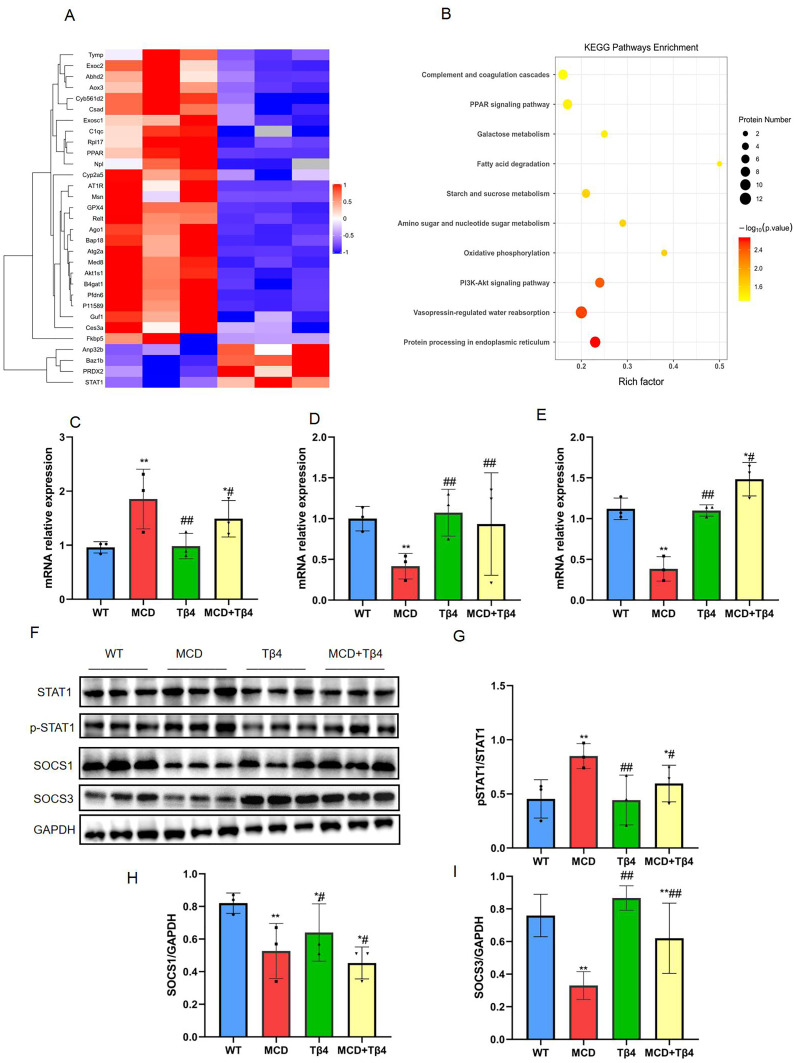
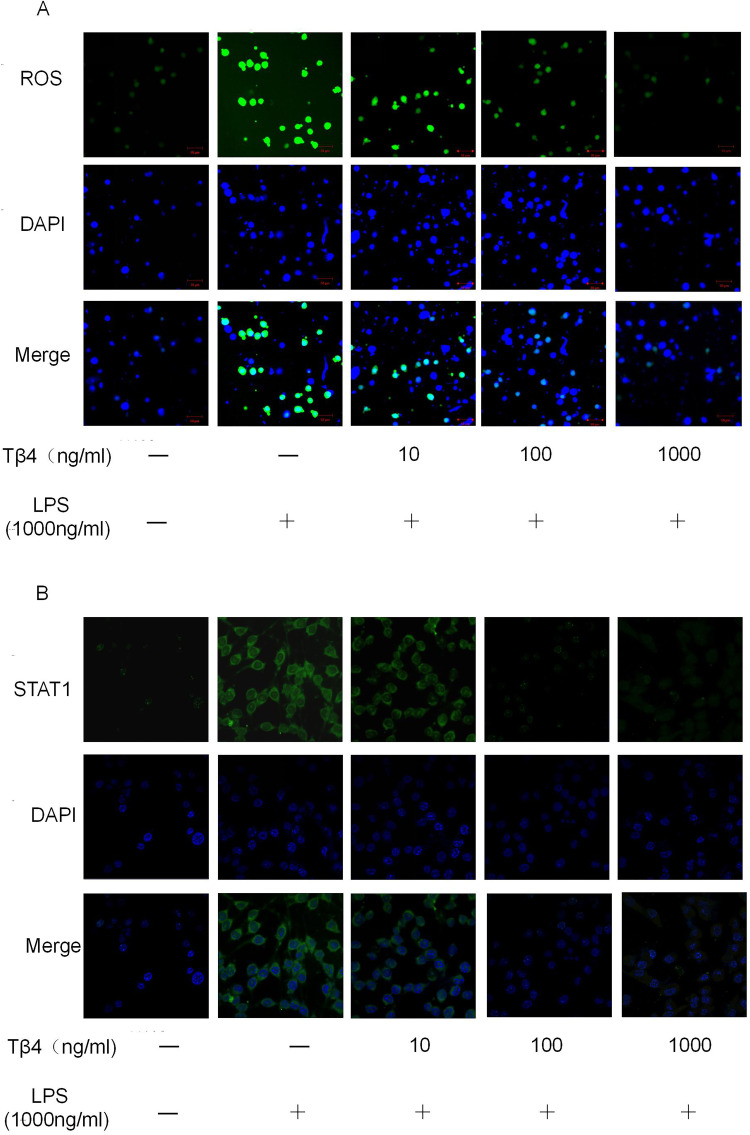
Results: Tβ4 allowed the mice to recover from NAFLD and reduce liver inflammation more effectively. Liver steatosis was more severe in sirnat4 mice. Macrophages are involved in Tβ4 treatment of NAFLD. The expression level of M1 phenotype in macrophages treated with Tβ4 decreased, and the apoptosis of hepatocytes decreased. At the same time, Tβ4 down-regulates signal transduction and activator of transcription1 (STAT1) phosphorylation and increases suppressor of cytokine signaling1/3 (SOCS1/3) expression in hepatocytes.

Discussion: This study revealed the molecular mechanism of the effective effect of Tβ4 on the polarization of liver macrophages, suggesting that Tβ4 may be a potential therapeutic measure for NAFLD.

Keywords: NAFLD; inflammation; macrophage; thymosin beta 4.


Conflict of interest statement

The authors declare no competing interests in this work.

Figures

Figure 1
Figure 1
Changes in the level of Tβ4 in NALFD. (A) Tβ4 expression is reduced in NALFD disease. (B) Low level of Tβ4 expression in serum of NALFD patients. (C) Reduced levels of Tβ4 expression in tissues adjacent to steatotic primary hepatocellular carcinoma. **P<0.01.
Figure 2
Figure 2
Effects of Tβ4 on biochemical, lipid metabolism and lipid accumulation indices in MCD-induced NAFLD rats. (A) Structural formula of the monomer of the active substance of Tβ4. (B) Timeline of treatment in Tβ4+MCD group. (C) Tβ4 reduces the body weight of NAFLD mice (D) Liver weight of mice at execution in different groups. (E) Tβ4 reduces serum alanine aminotransferase (ALT) levels in NAFLD mice. (F) Tβ4 reduces serum levels of aspartate aminotransferase (AST) in NAFLD mice. (G) Tβ4 reduces serum levels of total protein (TP) in NAFLD mice. (H) Tβ4 reduces hepatic inflammatory response and lipid accumulation in NAFLD mice. Red and yellow arrows indicate fatty lesions and inflammatory infiltration of the liver. Compared with WT group, *P<0.05 and **P<0.01; compared with MCD group, #P<0.05 and ##P<0.01.
Figure 3
Figure 3
Effect of Tβ4 on antioxidant parameters in MCD-induced NAFLD mice. (A) Glutathione peroxidase (GSH-Px) levels in serum of mice in each group. (B) Serum levels of malondialdehyde (MDA) in mice in each group. (C) Glutathione peroxidase (GSH-Px) levels in the liver of mice in each group. (D) Malondialdehyde (MDA) levels in the liver of mice in each group. (E) Heavy cell necrosis in the liver of mice in each group. (F) Electron microscopy of the livers of mice in each group. (G) Tβ4 effectively reduces ROS levels in single-cell suspensions of NAFLD mouse livers (DCFH-DA was used as a probe). All results are the mean of 3 repetitions of the experiment. The normal control group (NC group) was C57 mice fed with regular chow, and the methionine deficient diet model group (MCD group) was mice successfully modelled by methionine choline deficient chow fed for 8 weeks.The Tβ4 group was injected with Tβ4 (12 mg-kg-1-d-1) from week 9 onwards on top of regular chow for a total of 4 weeks.The MCD+Tβ4 group was injected with Tβ4 (12 mg-kg-1-d-1) from week 9 onwards on top of methionine deficient chow fed for a total of 4 weeks.The MCD+Tβ4 group was injected with Tβ4 (12 mg-kg-1-d-1) from week 9 onwards on top of regular chow. Tβ4 (12 mg-kg-1-d-1) injection from week 9 for a total of 4 weeks. The red arrow on the electron microscope shows the damage of organelles. Data are expressed as mean ± S.E.M; *P < 0.05, **P < 0.01, compared with normal control group (WT group). #P < 0.05, ##P < 0.01, compared with the model group (MCD group).
Figure 4
Figure 4
Tβ4 induces macrophage polarisation towards M2 type. (A) Liver F4/80 expression in mice of each group. (B) Double-stained fluorescence intensity expression of F4/80 and CD206 in the liver of mice in each group. The Tβ4 group was injected with Tβ4 (12 mg-kg-1-d-1) from week 9 onwards for a total of 4 weeks on the basis of regular chow feeding. The MCD+Tβ4 group was injected with Tβ4 (12 mg-kg-1-d-1) from week 9 onwards for a total of 4 weeks on the basis of methionine-deficient chow feeding. Data are expressed as mean ± S.E.M; *P < 0.05, **P < 0.01, compared with normal control group (WT group). #P < 0.05, ##P < 0.01, compared with the model group (MCD group). (C) mRNA expression levels of inducible nitric oxide synthase (iNOS), tumour necrosis factor-α (TNF-α) and interleukin 1β (IL-1β) in M1-type macrophages in in vitro experiments. (D) mRNA expression levels of arginase 1 (ARG1) and interleukin 10 (IL-10) in M2-type macrophages in the in vitro experiments. The DMSO group was induced by DMSO after isolation of primary mouse hepatic macrophages. The Tβ4 group was induced by Tβ4 after isolation of primary hepatic macrophages, and the induction time was 24 hours for both groups. Data are expressed as mean ± S.E.M; *P < 0.05, **P < 0.01, compared with DMSO group.
Figure 5
Figure 5
Tβ4 deficiency exacerbates lipid metabolism disorders in mice. (A) HE staining of mouse liver in each group. (B) Oil-red staining of mouse liver in each group. (C) Concentration levels of total triglyceride (TG) in serum of mice in each group. (D) Concentration level of total cholesterol (TC) in serum of mice in each group. (E) Concentration levels of total triglycerides (TG) in the liver of mice in each group. (F) Concentration levels of total cholesterol (TC) in the livers of mice in each group. Data are expressed as mean ± S.E.M; Red and yellow arrows indicate fatty lesions and inflammatory infiltration of the liver. *P < 0.05, **P < 0.01, compared with NC-WT group. #P < 0.05, ##P < 0.01, compared with NC-siRNA.
Figure 6
Figure 6
Tβ4 modulates macrophage polarisation to ameliorate hepatic inflammation and lipid metabolism disorders in mice. (A) Immunohistochemistry of mouse liver F4/80 in each group. (B) Glucose tolerance test in mice of each group. (C) Insulin resistance assay in each group of mice. (D) Concentration level of ALT in serum of each group of mice. (E) Concentration levels of AST in serum of each group of mice. (F) Concentration levels of total triglycerides (TG) in serum of mice in each group. (G) Concentration levels of total triglycerides (TG) in serum of mice in each group. (H) Concentration levels of interleukin 4 in serum of mice in each group. (I) Concentration levels of interleukin 1β in serum of mice in each group. Data are expressed as mean ± S.E.M; *P < 0.05, **P < 0.01, compared with MCD+Tβ4 group. #P < 0.05, ##P < 0.01, compared with MCD+Clod.Lipo+Tβ4 group.
Figure 7
Figure 7
Tβ4 improves NAFLD by regulating the STAT1/SOCS1 signaling pathway. (A) Protein cluster heat map of MCD and MCD+Tβ4 mice (B) Enrichment map of KEGG-related signaling pathway of Tβ4 treated NAFLD mice (C) liver STAT1 mRNA level of mice in each group (D) liver SOCS1 mRNA level of mice in each group (E) liver SOCS3 mRNA level of mice in each group (F) Liver STAT1 signaling pathway protein expression of mice in each group (G) liver p-STAT1 protein level of mice in each group (H) liver SOCS1 protein level of mice in each group (I) liver SOCS3 protein level of mice in each group. Data are expressed as mean ±S.E.M. *P < 0.05, **P < 0.01, compared with WT group. #P < 0.05, ##P < 0.01, compared with MCD group.
Figure 8
Figure 8
Tβ4 ameliorates hepatocyte injury after cell co-culture.(A) Schematic diagram of cell co-culture pattern (B) Tβ4 enhanced fine blog M2 polarization of macrophages and decreased serum alanine aminotransferase (ALT) levels in the supernatant of LO2 cells. (C) Tβ4 enhancement of M2-type polarization in macrophages decreased serum aspartate aminotransferase (AST) levels in the supernatant of LO2 cells. (D) Apoptosis and necrosis of cells in each group under optical microscope. D-A was the group without Tβ4 and LPS.D-b was LPS stimulated group, c-e was LPS stimulated Tβ4 intervention concentration of 10,100,1000ng/mL.(E) Detection of apoptosis of LO2 cells by Tβ4 in AnnexinV/PI co-culture system. Cell apoptosis was late in C2 quadrant and early in C4 quadrant. All data were repeated three times, and the a-e group was the same as that of (D). The assay results showed (E) that flow cytometry detected a large amount of apoptosis in the Model group (E-b), and the overall apoptosis rate was reduced in both Tβ4-treated groups (E c-e) compared with the Model group, suggesting that the effect of Tβ4 in ameliorating LO2 injury involves the whole process of apoptosis in both the early and late stages of the cell death. All data were replicated three times and expressed as mean ± S.E.M *p<0.05 and **p<0.01 compared with Tβ4(-)/LPS(-) group; #p<0.05 and ##p<0.01 compared with Tβ4(-)/LPS(+) group.
Figure 9
Figure 9
Tβ4 inhibits STAT phosphorylation in hepatocytes after cell co-culture. (A) Tβ4 effectively reduced ROS levels in LO2 cells in cell co-culture experiments. (B) Immunofluorescence localisation assay (n=3) was used to observe STAT phosphorylation levels in LO2 cells. Green fluorescence represents p-STAT expression, and fluorescence intensity is proportional to protein expression. Blue: cell nuclei stained with DAPI; Merge: first two images overlapped; Scale bar: 100 μm.

Similar articles

References

    1. Friedman SL, Neuschwander-Tetri BA, Rinella M, Sanyal AJ. Mechanisms of NAFLD development and therapeutic strategies. Nat Med. 2018;24(7):908–922. doi:10.1038/s41591-018-0104-9 - DOI - PMC - PubMed
    1. Pouwels S, Sakran N, Graham Y, et al. Non-alcoholic fatty liver disease (NAFLD): a review of pathophysiology, clinical management and effects of weight loss. BMC Endocr Disord. 2022;22(1):63. doi:10.1186/s12902-022-00980-1 - DOI - PMC - PubMed
    1. Tilg H, Adolph TE, Moschen AR. Multiple parallel hits hypothesis in nonalcoholic fatty liver disease: revisited after a decade. Hepatology. 2021;73(2):833–842. doi:10.1002/hep.31518 - DOI - PMC - PubMed
    1. Barreby E, Chen P, Aouadi M. Macrophage functional diversity in NAFLD - more than inflammation. Nat Rev Endocrinol. 2022;18(8):461–472. doi:10.1038/s41574-022-00675-6 - DOI - PubMed
    1. Gao H, Jin Z, Bandyopadhyay G, et al. MiR-690 treatment causes decreased fibrosis and steatosis and restores specific Kupffer cell functions in NASH. Cell Metab. 2022;34(7):978–990. doi:10.1016/j.cmet.2022.05.008 - DOI - PMC - PubMed