

Clinical, Electroencephalogram and Imaging Characteristics of Patients With Anti-LGI1 Antibody Encephalitis: A Multicenter Cohort Study
- PMID: 40322833
- PMCID: PMC12051031
- DOI: 10.1111/cns.70414
Clinical, Electroencephalogram and Imaging Characteristics of Patients With Anti-LGI1 Antibody Encephalitis: A Multicenter Cohort Study
Abstract
Objectives: To summarize the clinical, electroencephalogram (EEG), and imaging characteristics of patients with anti-leucine-rich glioma-inactivated 1 autoimmune encephalitis (LGI1-AE) and provide a reference for clinical diagnosis and treatment.
Methods: We retrospectively analyzed 88 patients diagnosed with LGI1-AE between January 2018 and April 2024 in the Department of Neurology, Huashan Hospital, Fudan University, and the First Hospital of Jilin University.
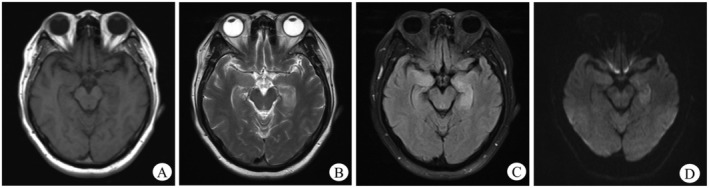
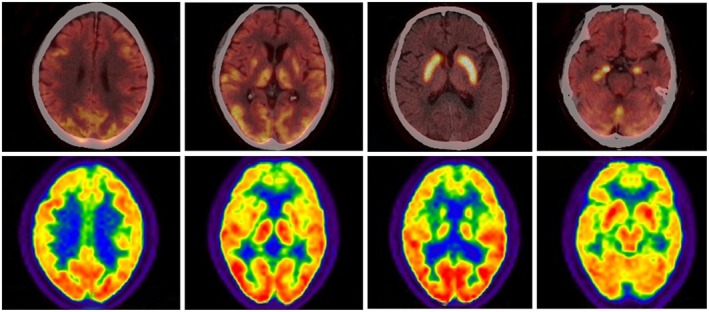
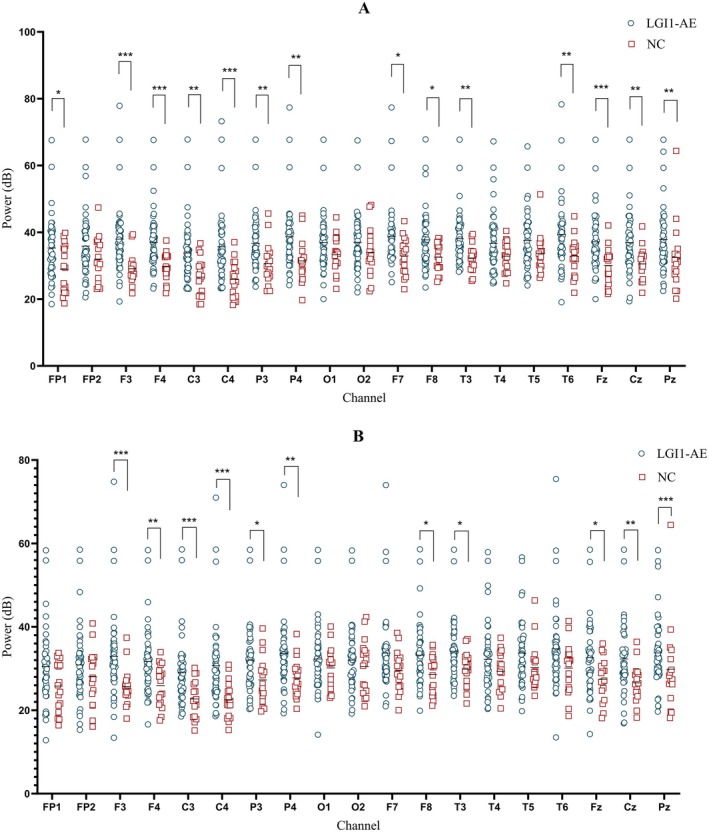
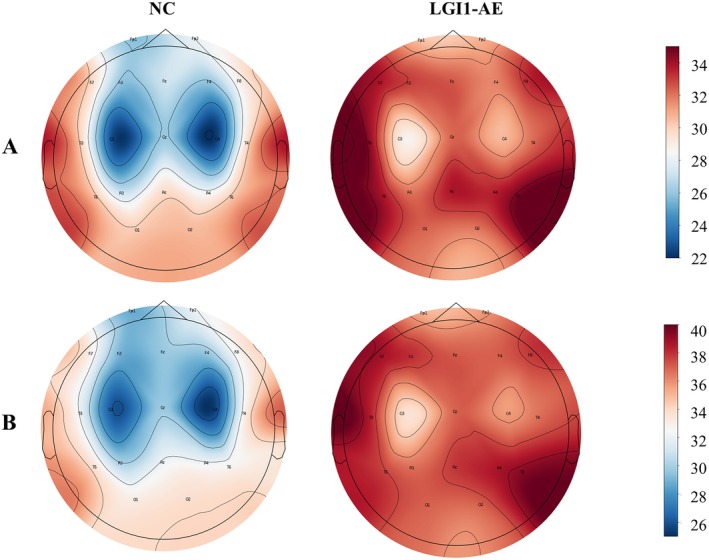
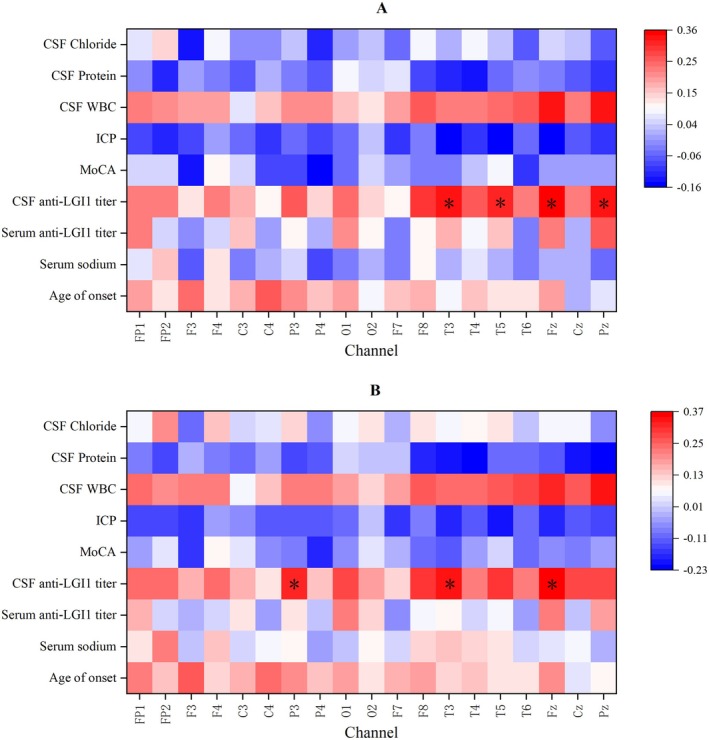
Results: This retrospective study analyzed 88 patients diagnosed with LGI1-AE. The initial clinical presentation predominantly featured rapidly progressive cognitive impairment (RPCI) (51.1%) and seizures (50%). Brain magnetic resonance imaging and 18 F-fluorodeoxyglucose positron emission tomography (18F-FDG PET) indicated predominant lesion localization in the unilateral or bilateral temporal lobe and/or basal ganglia. Abnormal EEG was observed in 66 cases (79.5%). LGI1-AE cases had increased power in the low-frequency bands (δ and θ) compared to normal controls. Low-frequency band (δ and θ) power in T3 and Fz channels was positively correlated with LGI1 antibody titers in cerebrospinal fluid (CSF). Spearman correlation analysis showed that baseline modified Rankin Scale (mRS) scores were correlated with serum antibody titers and CSF antibody titers.
Conclusions: Baseline mRS scores and low-frequency power in the frontotemporal region showed a positive correlation with anti-LGI1 antibody titers, suggesting that antibody levels may reflect disease severity in LGI1 autoimmune encephalitis. Further studies are warranted to validate these associations in prospective multicenter cohorts.
Keywords: anti‐LGI1 encephalitis; autoimmune disease; behavioral and psychological symptoms; electroencephalogram; rapidly progressing cognitive impairment; seizures.
© 2025 The Author(s). CNS Neuroscience & Therapeutics published by John Wiley & Sons Ltd.
Conflict of interest statement
The authors declare no conflicts of interest.
Figures
Similar articles
-
Autoimmune encephalitis associated with voltage-gated potassium channels-complex and leucine-rich glioma-inactivated 1 antibodies - a national cohort study.Eur J Neurol. 2017 Aug;24(8):999-1005. doi: 10.1111/ene.13324. Epub 2017 May 25. Eur J Neurol. 2017. PMID: 28544133
-
Clinical features of 28 cases of anti-leucine-rich glioma-inactivated protein 1 encephalitis and anti-contactin-associated protein-like 2 encephalitis.Zhong Nan Da Xue Xue Bao Yi Xue Ban. 2023 Mar 28;48(3):386-396. doi: 10.11817/j.issn.1672-7347.2023.220548. Zhong Nan Da Xue Xue Bao Yi Xue Ban. 2023. PMID: 37164922 Free PMC article. Chinese, English.
-
Cortical and Subcortical Dysmetabolism Are Dynamic Markers of Clinical Disability and Course in Anti-LGI1 Encephalitis.Neurol Neuroimmunol Neuroinflamm. 2022 Jan 28;9(2):e1136. doi: 10.1212/NXI.0000000000001136. Print 2022 Mar. Neurol Neuroimmunol Neuroinflamm. 2022. PMID: 35091466 Free PMC article.
-
Antibody-LGI 1 autoimmune encephalitis manifesting as rapidly progressive dementia and hyponatremia: a case report and literature review.BMC Neurol. 2019 Feb 7;19(1):19. doi: 10.1186/s12883-019-1251-4. BMC Neurol. 2019. PMID: 30732585 Free PMC article. Review.
-
[Anti-leucine-rich glioma-inactivated 1 (LGI1) encephalitis diagnosed from T1 signal intensity changes in basal ganglia: a case report and literature review].Rinsho Shinkeigaku. 2025 Jun 26;65(6):429-435. doi: 10.5692/clinicalneurol.cn-002084. Epub 2025 May 20. Rinsho Shinkeigaku. 2025. PMID: 40399057 Review. Japanese.
Cited by
-
Dual diagnosis of neurobrucellosis and Anti-LGI1 encephalitis: a rare case report.BMC Infect Dis. 2025 Jul 28;25(1):949. doi: 10.1186/s12879-025-11361-z. BMC Infect Dis. 2025. PMID: 40722146 Free PMC article.
References
Publication types
MeSH terms
Substances
Grants and funding
LinkOut - more resources
Full Text Sources
Medical
Miscellaneous
