. 2025 May 1;5(5):825-840.
doi: 10.1158/2767-9764.CRC-24-0442.

APOBEC3 Activity Promotes the Survival and Evolution of Drug-Tolerant Persister Cells during EGFR Inhibitor Resistance in Lung Cancer

Affiliations

APOBEC3 Activity Promotes the Survival and Evolution of Drug-Tolerant Persister Cells during EGFR Inhibitor Resistance in Lung Cancer

Nina Marie G Garcia et al. Cancer Res Commun. .

Abstract

APOBEC mutagenesis is one of the most common endogenous sources of mutations in human cancer and is a major source of genetic intratumor heterogeneity. High levels of APOBEC mutagenesis are associated with poor prognosis and aggressive disease across diverse cancers, but the mechanistic and functional impacts of APOBEC mutagenesis on tumor evolution and therapy resistance remain relatively unexplored. To address this, we investigated the contribution of APOBEC mutagenesis to acquired therapy resistance in a model of EGFR-mutant non-small cell lung cancer. We find that inhibition of EGFR in lung cancer cells leads to a rapid and pronounced induction of APOBEC3 expression and activity. Functionally, APOBEC expression promotes the survival of drug-tolerant persister cells (DTP) following EGFR inhibition. Constitutive expression of APOBEC3B alters the evolutionary trajectory of acquired resistance to the EGFR inhibitor gefitinib, making it more likely that resistance arises through de novo acquisition of the T790M gatekeeper mutation and squamous transdifferentiation during the DTP state. APOBEC3B expression is associated with increased expression of the squamous cell transcription factor ΔNp63 and squamous cell transdifferentiation in gefitinib-resistant cells. Knockout of p63 in gefitinib-resistant cells reduces the expression of the ΔNp63 target genes IL-1α/β and sensitizes these cells to the third-generation EGFR inhibitor osimertinib. These results suggest that APOBEC activity promotes acquired resistance by facilitating evolution and transdifferentiation in DTPs and that approaches to target ΔNp63 in gefitinib-resistant lung cancers may have therapeutic benefit.

Significance: APOBEC mutagenesis is a common source of genetic heterogeneity in cancer, and APOBEC mutational signatures are enriched in metastatic and drug-resistant tumors. However, the mechanisms through which APOBEC3 enzymes promote tumor evolution remain unknown. In this study, we show that APOBEC3 activity contributes to the development of therapy-resistant cancer cells by promoting evolution of DTP cells. These findings offer insights into the role of APOBEC mutagenesis in cancer progression.


Conflict of interest statement

N.M.G. Garcia reports grants from Howard Hughes Medical Institute Gilliam Fellowship during the conduct of the study. A.V. DiMarco reports grants from NCI and NIH during the conduct of the study, as well as personal fees from Genentech and Merck outside the submitted work. J.V. Alvarez reports grants from NCI during the conduct of the study. No disclosures were reported by the other authors.

Figures

Figure 1
Figure 1
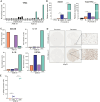
APOBEC3 activity is induced following EGFR inhibition. A, qRT-PCR analysis of a representative experiment showing A3A and A3B expression in PC9 cells following treatment with gefitinib or osimertinib for 24 hours. Error bars represent SEM of two biological replicates. Significance relative to the vehicle was determined using an unpaired t test. ***, P < 0.0005; ****, P < 0.0001. B, Western blots for A3B protein in PC9 cells following treatment with gefitinib or osimertinib for 24 hours. BT474 cells are shown as a positive control. Short and long exposures for A3B are shown. C, In vitro deaminase activity of PC9 cells treated with gefitinib or osimertinib for 24 hours. BT474 and SKBR3 cells are shown as positive and negative controls, respectively. % deamination was calculated as described in “Materials and Methods”. D, Quantification of % deamination shown in C. Error bars represent SEM of two technical replicates. Significance relative to the vehicle was determined using an unpaired t test. ***, P < 0.0005. E, Western blots for A3B protein in PC9 cells expressing nontargeting gRNAs (NT) or gRNAs targeting both A3A and A3B (A3A/A3B KO). A pooled population is shown for NT cells, and two clones are shown for A3A/A3B-KO cells. Cells were treated with gefitinib or osimertinib for 24 hours. F, In vitro deaminase activity of PC9 cells expressing nontargeting gRNAs (NT) or gRNAs targeting both A3A and A3B (A3A/A3B KO). A pooled population is shown for NT cells, and two clones are shown A3A/A3B KO cells. Cells were treated with gefitinib or osimertinib for 24 hours, and % deamination was calculated as described in “Materials and Methods”. G, Quantification of % deamination shown in F. Error bars represent SEM of two technical replicates. Significance relative to the NT vehicle was determined using an unpaired t test. *, P < 0.05; **, P < 0.005. H, Schematic of competition assay via flow cytometry. PC9 cells expressing nontargeting gRNAs (NT) or gRNAs targeting both A3A and A3B (A3A/A3B KO) were used for the experiment. I, Quantification of % live cells, either GFP negative or positive, after 7 or 14 days of EGFR inhibition. A pooled population is shown for NT cells and two clones are shown for A3A/A3B-KO cells. Error bars represent SEM of two biological replicates. An unpaired t test was used to determine statistical significance of GFP-positive cells in the treated condition relative to vehicle. *, P < 0.05; **, P < 0.005; ***, P < 0.0005. Gef, gefitinib; Osi, osimertinib; Veh, vehicle.
Figure 2
Figure 2
Engineering an inducible system for APOBEC3B expression in PC9 cells. A, qRT-PCR analysis showing A3A and A3B expression in PC9 cells following treatment with gefitinib or osimertinib over the course of 14 days. Error bars represent SEM of three technical replicates. Veh, vehicle. B, Schematic of Cre-inducible APOBEC3B expression. C, qRT-PCR analysis showing A3B expression in PC9 cells following infection with Cre recombinase. Error bars represent SEM of three technical replicates. *, P < 0.05. BT474 and SKBR3 cells are shown as controls. D, Western blots showing protein expression of HA-tagged A3B in PC9 cells following infection with Cre recombinase. E, In vitro deaminase activity assay in PC9 cells following infection with Cre recombinase. BT474 and SKBR3 cells are shown as controls. % deamination was calculated as described in “Materials and Methods”. F, Quantification of % deamination in two replicates of control PC9 cells (−Cre) and five replicates of A3B-expressing PC9 (+Cre). % deamination was calculated as described in “Materials and Methods”. An unpaired t test was performed to determine statistical significance. **, P < 0.005. G, Growth curves for PC9 cells expressing A3B (+Cre) or control cells (−Cre). Error bars represent SEM of two biological replicates. A two-way ANOVA was performed to determine statistical significance. ns, not significant.
Figure 3
Figure 3
APOBEC3B expression alters the evolutionary trajectory of acquired resistance to EGFR inhibitors. A, Kinetics of evolution of gefitinib resistance in PC9 cells with or without A3B expression. B, Representative dose–response curves to gefitinib for sensitive and resistant A3B-off and A3B-on PC9 cells. C, Quantification of the AUC of dose–response curves for gefitinib-sensitive and GR A3B-off and A3B-on PC9 cells. An unpaired t test was performed to determine statistical significance. **, P < 0.05; ***, P < 0.0005. D, Frequency of EGFRT790M mutation as determined by droplet digital PCR in gefitinib-sensitive and GR A3B-off and A3B-on PC9 cells. % EGFRT790M was calculated as described in “Materials and Methods”. E, Contingency tables summarizing the relationship between resistance kinetics and EGFR mutation status in A3B-off and A3B-on PC9 cells. Res, resistant.
Figure 4
Figure 4
Integrated genomic analysis of GR PC9 cells. A, Quantification of mutations per exome in A3B-off and A3B-on GR cells. Mutations were called as described in “Materials and Methods”. B, PCA from RNA-seq data. C, Gene set enrichment analysis comparing A3B-on and A3B-off sensitive PC9 cells.
Figure 5
Figure 5
APOBEC3B-expressing PC9 cells show evidence of squamous cell transdifferentiation during acquired gefitinib resistance. A, Normalized gene counts for TP63 from RNA-seq in gefitinib-sensitive and GR PC9 cells, with or without A3B expression. B, qRT-PCR analysis showing ∆Np63 and total p63 mRNA expression in gefitinib-sensitive and GR PC9 A3B-on cells. Parental PC9 are shown as a control. Error bars represent SEM of three technical replicates. An unpaired t test was performed to determine statistical significance. ***, P < 0.0005; ****, P < 0.0001. C, Normalized gene counts for MUC5B, IL-1A, IL-1B, and KRT6A from RNA-seq in gefitinib-sensitive and GR PC9 cells expressing A3B. D, IHC images showing ∆Np63 protein expression in sensitive and resistant PC9 A3B-on cells. Insets are shown at 20× magnification. E, Quantification of ∆Np63-positive cells for sensitive and resistant PC9 A3B-on cells shown in D. Each point represents a field of view at 20× magnification. Error bars represent SEM of five fields of view. An unpaired t test was performed to determine statistical significance. ***, P < 0.0005; ****, P < 0.0001.
Figure 6
Figure 6
p63 knockout reduces inflammatory gene expression and sensitizes PC9 GR cells to EGFR inhibition. A, Dose–response curve of osimertinib in gefitinib-sensitive and GR PC9 cells expressing A3B. Viability was measured using CellTiter Glo following 3 days of drug treatment. A two-way ANOVA with the Tukey multiple comparisons test was used to determine statistical significance at each dose. ****, P < 0.0001 when comparing PC9 A3B-on GRF and GRE cells at the indicated dose. B, Western blots for pEGFR (Y1068) and total EGFR in gefitinib-sensitive and GR PC9 cells expressing A3B. Cells were treated with osimertinib (Osi) for 24 hours. C, Western blots for p63α in PC9 A3B-on GRF cells expressing an empty vector or gRNAs targeting p63 (sg1 and sg3). PC9 A3B-on F cells are shown as a control. D, qRT-PCR analysis showing IL-1A and IL-1B expression in PC9 A3B-on GRF cells expressing an empty vector or gRNAs targeting p63 (sg1 and sg3). PC9 A3B-on F cells are shown as a control. Error bars represent SEM of three technical replicates. An unpaired t test was performed to determine statistical significance. **, P < 0.005; ****, P < 0.0001. E, In vitro growth curves of PC9 A3B-on GRF cells with or without p63 knockout. A two-way ANOVA was performed to determine statistical significance. ns, not significant. F, Dose–response curve of osimertinib in PC9 A3B-on GRF cells expressing an empty vector or gRNAs targeting p63 (sg1 and sg3). Viability was measured using CellTiter Glo following 3 days of drug treatment. A two-way ANOVA was performed, which determined a significant p63 status × dose interaction with a P value of 0.02. G, Viability of PC9 A3B-on GRF cells expressing an empty vector or gRNAs targeting p63 (sg1 and sg3) following treatment with osimertinib for 6 days. A two-way ANOVA with the Dunnett test was performed to determine statistical significance. ****, P < 0.00001. H, Model for the function of APOBEC3 in the survival and evolution of DTP cells during acquired resistance to EGFR inhibition. EGFR inhibition leads to STAT1-dependent upregulation of A3A and A3B. The expression of A3A and A3B is required for the survival of DTPs and is associated with an increased frequency of ∆Np63 upregulaiton and squamous transdifferentiation in the drug-resistant state. ∆Np63 expression in drug-resistant cells promotes osimertinib resistance in part through upregulation of EGFR ligands.

Update of

Similar articles

Cited by

References

    1. Nik-Zainal S, Morganella S. Mutational signatures in breast cancer: the problem at the DNA level. Clin Cancer Res 2017;23:2617–29. - PMC - PubMed
    1. Alexandrov LB, Nik-Zainal S, Wedge DC, Campbell PJ, Stratton MR. Deciphering signatures of mutational processes operative in human cancer. Cell Rep 2013;3:246–59. - PMC - PubMed
    1. Helleday T, Eshtad S, Nik-Zainal S. Mechanisms underlying mutational signatures in human cancers. Nat Rev Genet 2014;15:585–98. - PMC - PubMed
    1. Alexandrov LB, Nik-Zainal S, Wedge DC, Aparicio SAJR, Behjati S, Biankin AV, et al. . Signatures of mutational processes in human cancer. Nature 2013;500:415–21. - PMC - PubMed
    1. Jamal-Hanjani M, Wilson GA, McGranahan N, Birkbak NJ, Watkins TBK, Veeriah S, et al. . Tracking the evolution of non-small-cell lung cancer. N Engl J Med 2017;376:2109–21. - PubMed

MeSH terms