Oral Microbiome Profile of the US Population
- PMID: 40323603
- PMCID: PMC12053784
- DOI: 10.1001/jamanetworkopen.2025.8283
Oral Microbiome Profile of the US Population
Abstract
Importance: The oral microbiome likely plays key roles in human health. Yet, population-representative characterizations are lacking.
Objective: To characterize the composition, diversity, and correlates of the oral microbiome in US adults.
Design, setting, and participants: This cross-sectional study analyzed data from the population-representative National Health and Nutrition Examination Survey (NHANES) from 2009 to 2012. Microbiome data were made publicly available in 2024. NHANES participants were aged 18 to 69 years and provided oral rinse samples in 1 of 2 consecutive NHANES cycles (2009-2010 and 2011-2012).
Exposures: Demographic, socioeconomic, behavioral, anthropometric, metabolic, and clinical characteristics.
Main outcomes and measures: Oral microbiome measures, characterized through 16S ribosomal RNA gene sequencing, included α diversity (observed amplicon sequence variants [ASVs], Faith phylogenetic diversity, Shannon-Weiner Index, and Simpson Index); β diversity (unweighted UniFrac, weighted UniFrac, and Bray-Curtis dissimilarity); and prevalence and relative abundance at phylum level through genus level. Analyses accounted for the NHANES complex sample design.
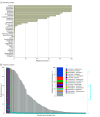
Results: This study included 8237 US adults aged 18 to 69 years, representing 202 314 000 individuals (102 813 000 men [50.8%]; mean [SD] age, 42.3 [14.4] years; 9.3% self-reported as Mexican American, 12.1% as non-Hispanic Black, 64.7% as non-Hispanic White, 5.9% as other Hispanic, and 8.1% as other non-Hispanic individuals). The oral microbiome encompassed 37 bacterial phyla, 99 classes, 212 orders, 446 families, and 1219 genera. Five phyla (Firmicutes, Actinobacteria, Bacteroidetes, Proteobacteria, and Fusobacteria) and 6 genera (Veillonella, Streptococcus, Prevotella 7, Rothia, Actinomyces, and Gemella) were present in nearly all US adults (weighted prevalence, >99%). These genera were the most abundant, accounting for 65.7% of total abundance. Observed ASVs showed a quadratic pattern with age (peak at 30 years), were similar by sex, significantly lower among non-Hispanic White individuals, and increased with greater body mass index (BMI), alcohol use, and periodontal disease severity. All covariates together accounted for a modest proportion of oral microbiome variability as measured by β diversity: R2 = 8.7% (95% CI, 8.4%-9.1%) for unweighted UniFrac, R2 = 7.2% (95% CI, 6.6%-7.7%) for weighted UniFrac, and R2 = 6.3% (95% CI, 3.1%-6.7%) for Bray-Curtis matrices. By contrast, relative abundance of a few genera explained a high percentage of variability in β diversity for weighted UniFrac: Aggregatibacter (R2 = 22.4%; 95% CI, 22.1%-22.8%), Lactococcus (R2 = 21.6%; 95% CI, 20.9%-22.3%), and Haemophilus (R2 = 18.4%; 95% CI, 18.1%-18.8%). Prevalence and relative abundance of numerous genera were associated with age, race and ethnicity, smoking, BMI categories, alcohol use, and periodontal disease severity.
Conclusions and relevance: This cross-sectional study of the oral microbiome in US adults showed that a few genera were universally present and a different set of genera explained a high percentage of oral microbiome diversity across the population. This comprehensive characterization provides a contemporary reference standard for future studies.
Conflict of interest statement
Figures


Update of
-
The mouth of America: the oral microbiome profile of the US population.medRxiv [Preprint]. 2024 Dec 7:2024.12.03.24318415. doi: 10.1101/2024.12.03.24318415. medRxiv. 2024. Update in: JAMA Netw Open. 2025 May 1;8(5):e258283. doi: 10.1001/jamanetworkopen.2025.8283. PMID: 39677463 Free PMC article. Updated. Preprint.
References
-
- Raizada MK, Joe B, Bryan NS, et al. . Report of the National Heart, Lung, and Blood Institute Working Group on the role of microbiota in blood pressure regulation: current status and future directions. Hypertension. Published online July 31, 2017. doi:10.1161/HYPERTENSIONAHA.117.09699 - DOI - PMC - PubMed
Publication types
MeSH terms
Substances
Grants and funding
LinkOut - more resources
Full Text Sources

