. 2025 May 5;20(5):e0322006.
doi: 10.1371/journal.pone.0322006. eCollection 2025.

Epigenetic background of lineage-specific gene expression landscapes of four Staphylococcus aureus hospital isolates

Affiliations

Epigenetic background of lineage-specific gene expression landscapes of four Staphylococcus aureus hospital isolates

Ilya S Korotetskiy et al. PLoS One. .

Abstract

Bacteria with similar genomes can exhibit different phenotypes due to alternative gene expression patterns. In this study, we analysed four antibiotic-resistant Staphylococcus aureus hospital isolates using transcriptomics, PacBio genome sequencing, and methylomics analyses. Transcriptomic data were obtained from cultures exposed to gentamicin, the iodine-alanine complex CC-196, and their combination. We observed strain-specific expression patterns of core and accessory genes that remained stable under antimicrobial stress - a phenomenon we term the Clonal Gene Expression Stability (CGES) that is the main discovery of the paper. An involvement of epigenetic mechanisms in stabilization of the CGES was hypothesized and statistically verified. Canonical methylation patterns controlled by type I restriction-modification systems accounted for ~ 10% of epigenetically modified adenine residues, whereas multiple non-canonically modified adenines were distributed sporadically due to imperfect DNA targeting by methyltransferases. Protein-coding sequences were characterized by a significantly lower frequency of modified nucleotides. Epigenetic modifications near transcription start codons showed a statistically significant negative association with gene expression levels. While the role of epigenetic modifications in gene regulation remains debatable, variations in non-canonical modification patterns may serve as markers of CGES.


Conflict of interest statement

The authors have declared that no competing interests exist.

Figures

Fig 1
Fig 1. Principle Component Analysis (PCA) plot of gene transcription patterns for four S. aureus strains grown under four different conditions.
Coloured dots represent individual transcription experiments for each strain under specific growth conditions, as indicated in the figure legend. Each experiment was performed in triplicate for all strains under the same conditions. The 95% confidence intervals along the two principal component axes estimated by the program PAST v.4.02, are outlined.
Fig 2
Fig 2. Atlas views of the genomes of
(A) S. aureus 150, (B) S. aureus 597/2, (C) S. aureus 598, and (D) S. aureus ATCC BAA-39. Green marks indicate the locations of identified restriction-modification (RM) genes. The GC-content and GC-skew values, calculated using a 5,000 bp sliding window, are represented by color-coded circular histograms, as explained in the figure legend.
Fig 3
Fig 3. Distribution of methylated canonical motifs across various genomic regions predicted by the program SeqWord Motif Mapper.
Each panel represents the distribution of various canonical motifs across four sequenced S. aureus genomes, as detailed in the panel titles. The graphs, from top to bottom, depict GC-content, GC-skew, and the number of methylated bases within 8 kbp sliding windows moving along chromosomal sequences with a 2 kbp step. Modified base densities in the lower histograms are depicted by bars extending above and below the average density line. Chromosomal coordinates are shown at the bottom of the panels. Identified inserts of mobile genetic elements (MGEs) are indicated by pink bars. Results of statistical analysis are presented on the right side of the panels, including Spearman correlation (SP) with confidence interval (ci) values between GC-content and GC-skew of sliding windows and the number of modified bases within the windows; Z-scores with standard errors and estimated p-values of biased distribution of modified bases across MGEs and core genomic parts, and between coding, non-coding, and TSC-upstream regions.
Fig 4
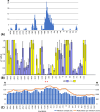
Fig 4. Associations between genome methylation and gene expression.
(A) Frequencies of achieving statistically significant associations between nucleotide methylation and gene expression in sliding windows, calculated using gradually changing program run parameters. This section of the figure was scaled to align the locations of modified nucleotides with the respective sliding window locations in section B. (B) Distribution of p-values calculated for selected optimal sliding window parameters: window size of 50 bp, stepping of 10 bp, and a NucMod score cut-off of 20 units. Genes were categorized into six expression levels. Sliding window locations meeting the Benjamini-Hochberg predicted FDR threshold (0.002 for α = 0.05) are marked by red asterisks. Yellow bars indicate positive linkage disequilibrium (LD), while blue bars indicate negative LD. Vertical black whiskers illustrate the range of variation in p-values across three calculations for each sliding window, with 2 bp positive and negative increments. (C) Numbers of all homologous gene pairs (N, left Y-axis) in four S. aureus genomes showing differences in gene expression levels and alternative methylation within the respective sliding windows, represented by bars. The number of methylated sites (M, right Y-axis) in the respective sliding windows across the four genomes is represented by a curve above the bars.
Fig 5
Fig 5. Plots of gene co-regulation in different test cultures treated with the antibiotic gentamicin (ge) and the iodine-containing complex CC 196 (cc).
(A) S. aureus 150 vs. S. aureus 597/2 treated with ge; (B) S. aureus 150 vs. S. aureus 597/2 treated with cc; (C) S. aureus 150 vs. S. aureus 598 treated with ge; (D) S. aureus 150 vs. S. aureus 598 treated with cc; (E) S. aureus 150 vs. S. aureus BAA 39 treated with ge; (F) S. aureus 150 vs. S. aureus BAA 39 treated with cc. Each coloured dot represents a pair of homologous genes in two genomes, plotted based on their Log₂FoldChange values of regulation in cultures treated with the antimicrobial compounds compared to the untreated control cultures. Different co-regulation types are indicated by a colour code explained in the figure legend.
Fig 6
Fig 6. Plots of gene co-regulation in test cultures treated with the antibiotic gentamicin (ge) and the iodine containing complex CC-196 (cc).
(A) S. aureus 150; (B) S. aureus 597/2; (C) S. aureus 598; and (D) S. aureus BAA-39. Each coloured dot represents a gene, plotted based on its Log2FoldChange values of regulation in cultures treated with GE (X-axis) and CC (Y-axis), compared to untreated control cultures. Different co-regulation types are indicated by a colour code explained in the figure legend.

Similar articles

References

    1. Levert M, Zamfir O, Clermont O, Bouvet O, Lespinats S, Hipeaux MC, et al.. Molecular and evolutionary bases of within-patient genotypic and phenotypic diversity in Escherichia coli extraintestinal infections. PLoS Pathog. 2010;6(9):e1001125. doi: 10.1371/journal.ppat.1001125 - DOI - PMC - PubMed
    1. Dominelli N, Jäger HY, Langer A, Brachmann A, Heermann R. High-throughput sequencing analysis reveals genomic similarity in phenotypic heterogeneous Photorhabdus luminescens cell populations. Ann Microbiol. 2022;72(1):20. doi: 10.1186/s13213-022-01677-5 - DOI
    1. Sánchez-Romero MA, Casadesús J. The bacterial epigenome. Nat Rev Microbiol. 2020;18(1):7–20. doi: 10.1038/s41579-019-0286-2. - PubMed
    1. Vasilchenko NG, Prazdnova EV, Lewitin E. Epigenetic mechanisms of gene expression regulation in bacteria of the Genus Bacillus. Russian J Gen. 2022;58:(1):1–19. doi: 10.1134/s1022795422010124 - DOI
    1. Vogt G. Environmental adaptation of genetically uniform organisms with the help of epigenetic mechanisms - An insightful perspective on ecoepigenetics. Epigenomes. 2022;7(1):1. doi: 10.3390/epigenomes7010001 - DOI - PMC - PubMed

MeSH terms

Substances

LinkOut - more resources