. 2025 May 5;20(5):e0322946.
doi: 10.1371/journal.pone.0322946. eCollection 2025.

Itaconate potentiates hepatic gluconeogenesis through NRF2 induction

Affiliations

Itaconate potentiates hepatic gluconeogenesis through NRF2 induction

Marwa O El-Derany et al. PLoS One. .

Abstract

The interplay between systemic metabolism and immune responses is increasingly recognized as a significant factor in the dysregulation of glucose homeostasis associated with diabetes and obesity. Immune metabolites play crucial roles in mediating this crosstalk, with itaconate emerging as an important immune metabolite involved in the inflammatory response of macrophages. Recent studies have highlighted the role of itaconate as a regulator of glucose metabolism, particularly in the context of obesity, although the underlying mechanisms remain poorly understood. In this study, we identified itaconate as one of the metabolites that significantly increase in the liver during fasting compared to fed conditions. Mechanistically, we found that itaconate enhances glucagon-induced liver gluconeogenesis independently of insulin signaling. Notably, itaconate upregulates the expression of gluconeogenic genes both under basal conditions and in the presence of palmitic acid. Furthermore, our data indicate that the effects of itaconate occur independently of CREB activation. Instead, we demonstrate that these potentiating effects are mediated through the induction of nuclear factor erythroid 2-related factor 2 (NRF2). Our findings demonstrate that itaconate has a glucagon-potentiating effects in the liver, suggesting that itaconate may play a significant role in the pathogenesis of metabolic-associated liver diseases.


Conflict of interest statement

The authors declare no competing financial interests.

Figures

Fig 1
Fig 1. Liver Itaconate increases following fasting.
A) Heat map, B) Pathways set of enriched metabolite set during fasting mouse models (n = 3), and C) Itaconate levels in fasting, fed and refed conditions. Fed mice were on regular chow diet, fasting mice were fasted overnight, refed mice were fasted overnight followed by refeeding for 2 hours. Each bar represents the mean value ± S.E.M. *p < 0.05, **p < 0.01, ***p < 0.001 as analyzed by One-way ANOVA followed by Tukey’s Post Test.
Fig 2
Fig 2. Liver IRG1 increases in fasting and following high fat diet (HFD).
IRG1 gene expression in whole livers of A) fasting and fed mice (n = 5) and C) following HFD for 4 months (n = 7). B) Hematoxylin and eosin stained sections of liver in mice on control diet or HFD. Each bar represents the mean value ± S.E.M. **p < 0.01 as analyzed by two-tailed t test.
Fig 3
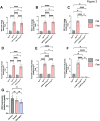
Fig 3. Itaconate during fasting is primarily produced from hepatic macrophages.
Liver IRG1 expression in fed and fasted mice in IRG1 A) hepatocyte, B) neutrophil, and C) macrophage knockout mice (n = 5). Liver itaconate levels in fed and fasted mice in IRG1 D) hepatocyte, E) neutrophil, and F) macrophage knockout mice (n = 5). G) Mouse primary macrophages were serum starved overnight then stimulated with glucagon (50 nM) for 6 hours or insulin (10nmol) then IRG1 gene expression was assessed. Each bar represents the mean value ± S.E.M. *p < 0.05, **p < 0.01, ***p < 0.001 as analyzed by One-way ANOVA followed by Tukey’s Post Test.
Fig 4
Fig 4. Itaconate does not alter liver insulin signaling.
Mouse primary hepatocytes were serum starved followed by pretreatment of DMI (250uM) for 3 hours and then cells were stimulated with insulin (10nM) for 10 min. A) Westerns and B-C) quantification of phospho AKT (p-AKT S473)/ total AKT or phospho-S6 (p-S6 Ser 240/244)/ total S6. β-actin was used as a loading control. The experiments with primary hepatocytes were done in triplicates (n = 3) and repeated at least three times.
Fig 5
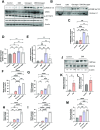
Fig 5. Itaconate potentiates liver glucagon-mediated gene expression.
Mouse primary hepatocytes were serum starved followed by addition of DMI (250μM) for 3 hours and then stimulated with glucagon (50 nM) for 10 min, A) whole cell lysates were assessed by western blot analysis, B) Chromatin bound fractions were assessed by Western blot analysis, C& D) quantification of phospo-CREB (p-CREB Ser 133)/ total CREB or phospho AKT (p-AKT S473)/ total AKT. E) quantification of chtomatin phosphor-CREB(p-CREB Ser 133)/histone H1. F and G) Mouse primary hepatocytes were serum starved followed by addition of DMI (250μM) for 3 hours and then stimulated with glucagon (50 nM) for 6 hours or H and I) prior to DMI treatment the cells were treated with palmitic acid (250μM). F, and H) G6pase and G and I) Pepck gene expression was assessed (n = 3). J) Westerns for G6Pase and Pepck and K-L) quantification of G6Pase or Pepck. β-actin was used as a loading control. M) Glucose production in primary hepatocytes pretreated for 1 hr with or without glucagon (50 nM) or DMI (250mM).The experiments with primary hepatocytes were done in triplicate and repeated at least three times The experiments with primary hepatocytes were done in triplicate and repeated at least three times. Each bar represents the mean value ± S.E.M. *p < 0.05, **p < 0.01, ***p < 0.001 as analyzed by One-way ANOVA followed by Tukey’s Post Test.
Fig 6
Fig 6. Itaconate potentiates liver glucagon signaling through NRF2.
A and B) Western blot and C) quantification of GCLM/β-actin in livers of fed and fasting mice (n = 4), D) quantification of GCLM/β-actin in livers of fed and HFD mice (n = 3) E) NRF2, F and G) Mouse primary hepatocytes were serum starved followed by addition of 4OI (250μM) for 3 hours and then stimulated with glucagon (50 nM) for 6 hours. F) G6pase and G) Pepck gene expression was assessed (n = 3). H) Westerns for Pepck and G6Pase and I-J) quantification of Pepck and G6Pase. Vinculin was used as a loading control. K) NRF2 gene expression in Nrf2F/F infected with empty adeno associated virus (AAV), L) G6pase and M) Pepck gene expression in primary hepatocytes isolated from Nrf2F/F infected with empty adeno associated virus (AAV) or AVV expressing Cre recombinase (n = 6), followed by serum starvation and addition of DMI (250μM) for 6 hours (n = 3). The experiments with primary hepatocytes were done in triplicate and repeated at least three times. Each bar represents the mean value ± S.E.M. *p < 0.05, **p < 0.01, ***p < 0.001 as analyzed by One-way ANOVA followed by Tukey’s Post Test.

References

    1. Nordlie RC, Foster JD, Lange AJ. Regulation of glucose production by the liver. Annu Rev Nutr. 1999;19:379–406. doi: 10.1146/annurev.nutr.19.1.379 - DOI - PubMed
    1. Han H-S, Kang G, Kim JS, Choi BH, Koo S-H. Regulation of glucose metabolism from a liver-centric perspective. Exp Mol Med. 2016;48(3):e218. doi: 10.1038/emm.2015.122 - DOI - PMC - PubMed
    1. Chi H. Immunometabolism at the intersection of metabolic signaling, cell fate, and systems immunology. Cell Mol Immunol. 2022;19(3):299–302. doi: 10.1038/s41423-022-00840-x - DOI - PMC - PubMed
    1. Li M, Chi X, Wang Y, Setrerrahmane S, Xie W, Xu H. Trends in insulin resistance: insights into mechanisms and therapeutic strategy. Signal Transduct Target Ther. 2022;7(1):216. doi: 10.1038/s41392-022-01073-0 - DOI - PMC - PubMed
    1. McGlone ER, Bloom SR, Tan TM-M. Glucagon resistance and metabolic-associated steatotic liver disease: a review of the evidence. J Endocrinol. 2024;261(3):e230365. doi: 10.1530/JOE-23-0365 - DOI - PMC - PubMed

LinkOut - more resources