. 2025 May 5;20(5):e0306505.
doi: 10.1371/journal.pone.0306505. eCollection 2025.

The non-specific phospholipase C of common bean PvNPC4 modulates roots and nodule development

Affiliations

The non-specific phospholipase C of common bean PvNPC4 modulates roots and nodule development

Ronal Pacheco et al. PLoS One. .

Abstract

Plant phospholipase C (PLC) proteins are phospholipid-degrading enzymes classified into two subfamilies: phosphoinositide-specific PLCs (PI-PLCs) and non-specific PLCs (NPCs). PI-PLCs have been widely studied in various biological contexts, including responses to abiotic and biotic stresses and plant development; NPCs have been less thoroughly studied. No PLC subfamily has been characterized in relation to the symbiotic interaction between Fabaceae (legume) species and the nitrogen-fixing bacteria called rhizobia. However, lipids are reported to be crucial to this interaction, and PLCs may therefore contribute to regulating legume-rhizobia symbiosis. In this work, we functionally characterized NPC4 from common bean (Phaseolus vulgaris L.) during rhizobial symbiosis, findings evidence that NPC4 plays an important role in bean root development. The knockdown of PvNPC4 by RNA interference (RNAi) resulted in fewer and shorter primary roots and fewer lateral roots than were seen in control plants. Importantly, this phenotype seems to be related to altered auxin signaling. In the bean-rhizobia symbiosis, PvNPC4 transcript abundance increased 3 days after inoculation with Rhizobium tropici. Moreover, the number of infection threads and nodules, as well as the transcript abundance of PvEnod40, a regulatory gene of early stages of symbiosis, decreased in PvNPC4-RNAi roots. Additionally, transcript abundance of genes involved in autoregulation of nodulation (AON) was altered by PvNPC4 silencing. These results indicate that PvNPC4 is a key regulator of root and nodule development, underscoring the participation of PLC in rhizobial symbiosis.


Conflict of interest statement

The authors have declared that no competing interests exist.

Figures

Fig 1
Fig 1. PLCs of leguminous and non-leguminous species are grouped into two clades.
The plant species used in this analysis are M. truncatula (Medtr), L. japonicus (Lj), G. max (Glyma), P. vulgaris (Phvul), A. thaliana (AT), and O. sativa (LOC Os). Blue indicates members from the PI-PLC clade; green indicates members from the NPC clade. The amino acid sequence of M. tuberculosis PLC (YP_009359121.1) was used as an outlier. The phylogenetic tree was reconstructed using the IQ-TREE algorithm based on the maximum-likelihood method and the JTT + G model; 10,000 bootstraps were performed.
Fig 2
Fig 2. PvPLC family contains gene duplication and has collinearity with GmPLC genes.
(A) PvPLC gene duplication analysis. (B) Collinearity analysis of PLC genes in common bean and soybean. Black lines show collinearity between PvPLC genes; red lines show collinearity between PvPLC and GmPLC genes.
Fig 3
Fig 3. PvNPC4 transcript abundance changes differentially during rhizobial symbiosis.
(A) Relative abundance of PvNPC4 transcript at early stages after inoculation with R. tropici. (B) Relative abundance PvNPC4 of transcript at 14 dpi with R. tropici. Roots-, not inoculated roots; Roots + , inoculated roots without nodules. The lower and upper edges of boxes delimit the first to third quartiles, respectively, the central horizontal line represents the median, and the whiskers indicate the maximum and minimum values in the data set. Statistical significance was assessed with a Monte Carlo simulation test with 9999 resamples without replacement (* p ≤ 0.05). Black dots in the box plots indicate independent samples from three biological replicates.
Fig 4
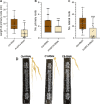
Fig 4. PvNPC4-RNAi reduced root development of composite plants.
(A) Length (cm) of primary hairy roots, (B) number of primary hairy roots, and (C) number of lateral hairy roots, (D) transgenic roots carrying the RNAi control vector or the PvNPC4 silencing construct. Ctrl-RNAi indicates roots carrying the control vector. PvNPC4-RNAi indicates transgenic roots carrying the PvNPC4 silencing construct (C1-RNAi and C8-RNAi lines). The lower and upper edges of boxes delimit the first to third quartiles, respectively, the central horizontal line represents the median, and the whiskers indicate the maximum and minimum values in the data set. For statistical analysis, a bootstrap test was performed with 9999 samples with replacement (** p ≤ 0.01, *** p ≤ 0.001, **** p ≤ 0.0001). Black dots in the box plots indicate individual samples from four biological replicates.
Fig 5
Fig 5. Transcript abundance of the PvASL18a, PvASL1b and PvPin1b genes in transgenic roots of common bean silenced in the PvNPC4 gene. (A) Relative transcript abundance of PvASL18a and PvASL18b, (B) relative transcript abundance of PvPin1b.
Ctrl-RNAi indicates transgenic roots carrying the control vector (pTdT-SAC). PvNPC4-RNAi indicates transgenic roots carrying the PvNPC4 silencing construct (C1-RNAi and C8-RNAi lines). The lower and upper edges of the boxes delimit the first to third quartiles, respectively, the central horizontal line represents the median, and the maximum and minimum values in the data set. For statistical analysis, a Monte Carlo simulation test was used with 9999 samples without replacement (* p ≤ 0.05, **** p ≤ 0.0001). Black dots in the box plots indicate individual samples from three biological replicates.
Fig 6
Fig 6. PvNPC4 silencing may regulate the numbers of infection threads and nodules in common bean hairy roots.
(A) Number of infection threads (ITs) per root at 10 dpi. (B) Number of nodules per root at 14 dpi. Ctrl-RNAi indicates transgenic roots carrying the control vector pTdT-SAC. PvNPC4-RNAi indicates transgenic roots carrying the PvNPC4 silencing construct (C1-RNAi and C8-RNAi lines). The lower and upper edges of the boxes delimit the first to third quartiles, respectively, the central horizontal line represents the median, and the whiskers indicate the maximum and minimum values in the data set. For statistical analysis of IT numbers, a Monte Carlo simulation test was used with 9999 samples without replacement (**** p ≤ 0.0001; two biological replicates). For the number of nodules, a bootstrap test was performed with 9999 samples with replacement (* p ≤ 0.01; three biological replicates). Black dots in the box plots indicate individual samples.
Fig 7
Fig 7. PvNPC4 silencing significantly reduces PvEnod40 transcript abundance.
Relative transcript abundance of PvNIN (A), PvEnod40 (B), and PvRbohA (C) at 10 dpi. Ctrl-RNAi indicates transgenic roots carrying the control vector pTdT-SAC. PvNPC4-RNAi indicates transgenic roots carrying the PvNPC4 silencing construct (C1-RNAi and C8-RNAi lines). The lower and upper edges of boxes delimit the first to third quartiles, respectively, the central horizontal line represents the median, and the whiskers indicate the maximum and minimum values in the data set. For statistical analysis, a Monte Carlo simulation test was used with 9999 samples without replacement (**** p 0.0001. Black dots in the box plots indicate individual samples from three biological replicates.
Fig 8
Fig 8. PvNPC4 silencing regulates PvRIC1, PvRIC2 and PvTLMa transcript abundance in transgenic roots.
Relative transcript abundance of PvRIC1 (A), PvRIC2 (B), and PvTLMa (C). Ctrl-RNAi indicates transgenic roots carrying the control vector pTdT-SAC. PvNPC4-RNAi indicates transgenic roots carrying the PvNPC4 silencing construct (C1-RNAi and C8-RNAi lines). The lower and upper edges of the boxes delimit the first to third quartiles, respectively, the central horizontal line represents the median, and the whiskers indicate the maximum and minimum values in the data set. For statistical analysis, a Monte Carlo simulation test was used with 9999 samples without replacement (**** p ≤ 0.0001). Black dots in the box plots indicate individual samples from three biological replicates.
Fig 9
Fig 9. Silencing of PvNPC4 does not affect the transcript abundance of PvASL18a but does alter that of PvASL18b.
Relative transcript abundance of PvASL18a (A) and PvASL18b (B). Ctrl-RNAi indicates transgenic roots carrying the control vector pTdT-SAC. PvNPC4-RNAi indicates transgenic roots carrying the PvNPC4 silencing construct (C1-RNAi and C8-RNAi lines). The lower and upper edges of the boxes delimit the first to third quartiles, respectively, the central horizontal line represents the median, and the whiskers indicate the maximum and minimum values in the data set. For statistical analysis, the Monte Carlo simulation test was used with 9999 samples without replacement (**** p ≤ 0.0001). Black dots in the box plots indicate individual samples from three biological replicates.
Fig 10
Fig 10. Proposed model of a signaling cascade in which NPC plays a key role in root and nodule development.
(A) PvNPC is activated, in an unknown manner, in response to NFs secreted by rhizobia (green lines). The hydrolytic activity of PvNPC4 on phosphatidylcholine releases phosphocholine, which is suggested to act as a secondary messenger to induce the transcription of symbiosis-related genes that regulates rhizobial infection and nodule development. At the same time, transcription of auxin response genes is activated, which also regulates rhizobial symbiosis, depending on the concentration and location of auxin. When NPC4 expression is altered by RNAi interference (PvNPC4-RNAi in this work, red lines), or by another stimulus, the NPC4 protein level decreases; consequently, the concentration of phosphocholine decreases. Therefore, the positive role of NPC4 in regulating nodule development fails or is attenuated. Our results showed that under these conditions, the transcript abundance of PvRIC1 and PvEnod40 is modulated, which may regulate nodule development. (B) Under normal conditions, NPC plays a positive regulatory role in root development (green lines), probably mediated by phosphocholine. If NPC expression is decreased, as explained above (red lines), transcription of genes involved in auxin signaling, a master regulator of root development is inhibited. This would provoke a decrease in root development. Our results indicated that PvASL18b is involved in this mechanism. In summary, our results suggest that PvNPC4 modulates both root and nodule development by regulating auxin-mediated signaling (black dashed arrows).

Similar articles

References

    1. Ferguson BJ, Mens C, Hastwell AH, Zhang M, Su H, Jones CH, et al.. Legume nodulation: The host controls the party. Plant Cell Environ. 2019;42(1):41–51. doi: 10.1111/pce.13348 - DOI - PubMed
    1. Roy S, Liu W, Nandety RS, Crook A, Mysore KS, Pislariu CI, et al.. Celebrating 20 Years of Genetic Discoveries in Legume Nodulation and Symbiotic Nitrogen Fixation. Plant Cell. 2020;32(1):15–41. doi: 10.1105/tpc.19.00279 - DOI - PMC - PubMed
    1. Lebedeva M, Azarakhsh M, Sadikova D, Lutova L. At the Root of Nodule Organogenesis: Conserved Regulatory Pathways Recruited by Rhizobia. Plants (Basel). 2021;10(12):2654. doi: 10.3390/plants10122654 - DOI - PMC - PubMed
    1. Wang D, Yang S, Tang F, Zhu H. Symbiosis specificity in the legume - rhizobial mutualism. Cellular Microbiology. 2012;14(3):334–42. doi: 10.1111/j.1462-5822.2011.01736.x - DOI - PubMed
    1. Liu H, Zhang C, Yang J, Yu N, Wang E. Hormone modulation of legume-rhizobial symbiosis. J Integr Plant Biol. 2018;60(8):632–48. doi: 10.1111/jipb.12653 - DOI - PubMed

MeSH terms