. 2025 Jul 3;146(1):13-28.
doi: 10.1182/blood.2024028136.

A novel mouse model of hemoglobin SC disease reveals mechanisms underlying beneficial effects of hydroxyurea

Affiliations

A novel mouse model of hemoglobin SC disease reveals mechanisms underlying beneficial effects of hydroxyurea

Tahereh Setayesh et al. Blood. .

Abstract

Sickle cell hemoglobin C (HbSC) disease results from compound heterozygosity of hemoglobin S (HbS) and hemoglobin C (HbC), comprising 30% of sickle cell disease (SCD). HbC induces red blood cell (RBC) dehydration/xerocytosis, which promotes sickling. HbSC-SCD causes significant morbidity despite being milder than homozygous HbSS-SCD. Current research/treatment strategies have focused on HbSS-SCD, whereas patients with HbSC are deprived of disease-modifying/transformative therapies because of lack of preclinical models. We generated HbSC mice, which resemble human HbSC-SCD: HbSC erythrocytes showed marked xerocytosis. Anemia, hemolysis, inflammation, and organ damage were milder than HbSS mice but hypoxia/reperfusion injury was similar. Retinopathy developed at higher frequency than HbSS mice (66.7% vs 16.7%; P < .05), as in patients with HbSC-SCD. Although HbSC RBCs sickled at lower oxygen tension than HbSS RBCs, they did not completely recover deformability after hypoxia/reoxygenation. Using the HbSC mice, we studied the mechanism by which hydroxyurea causes significant clinical benefit in patients with HbSC-SCD, despite minimal/modest increases in fetal Hb (HbF). We found hydroxyurea had distinct non-HbF and HbF effects. Hydroxyurea did not increase HbF in adult HbSC/HbSS mice but reduced RBC reactive oxygen species, ferryl Hb, and Heinz-body formation, thereby reducing membrane damage; however, RBC hydration was unaffected. When given to unborn pups before γ-globin expression was switched off, and continued postnatally, we could induce HbF in both HbSC and HbSS mice (higher HbF in HbSS vs HbSC mice). Minimal increases in HbF (∼1%) improved HbSC RBC hydration. Peak HbF levels of 7% in HbSC mice abrogated sickling. Overall, this HbSC model will help bridge the knowledge gap in mechanistic/therapeutic studies in this neglected disease.


Conflict of interest statement

Conflict-of-interest disclosure: The authors declare no competing financial interests.

Figures

None
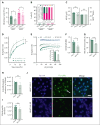
Graphical abstract
Figure 1.
Figure 1.
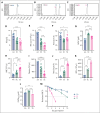
Derivation of HbSC mice and their hematological characteristics. (A-C) HPLC analysis on the peripheral blood of HbSC founder mouse along with HbAA (AA) and HbSS (SS) controls, showing expression of HbA (A), both HbS and HbC in the HbSC (SC) (B), and HbS (C). (D-I) Complete blood counts of blood from AA, SC, and SS mice, performed on the HT-5 hematology analyzer. Hb concentration (D), RBC counts (E), hematocrit (%) (F), MCHC (G), WBC counts (H), and platelets (I) are shown. (J) The percentage of reticulocytes was determined by flow cytometry on peripheral blood stained with thiazole orange. ARC (K) and CHCMRetic (L) were analyzed using the reticulocyte channel using the ADVIA-2010 hematology analyzer. For panels D through L: each symbol represents an individual mouse, and bars represent mean ± standard error of the mean. Statistics were performed using analysis of variance (ANOVA). ∗P < .05; ∗∗P < .01; ∗∗∗P < .001; ∗∗∗∗P < .00001. (M) RBC half-life was determined by serial blood analysis by flow cytometry for the percentage of biotinylated RBCs remaining after an initial intravenous injection of N-hydroxysulfosuccinimidobiotin. Symbols represent mean ± standard error of the mean of 3 to 5 mice per group. ARC, absolute reticulocyte count; WBC, white blood cell.
Figure 2.
Figure 2.
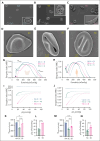
Morphology, hydration, and sickling kinetics of HbSC RBCs. (A-C) SEM images of AA, SC, and SS erythrocytes. Insets show an enlarged version of a classical and representative RBCs in each group. (D-F) Representative SC erythrocytes. Specimens were imaged using a Zeiss FE-SEM (Supra 35 VP) at 2 to 5 keV with a working distance of 3 to 5 mm using the Inlens detector. The magnification scale is shown within the micrographs and insets. (G) Osmoscan curves for mRBCs, showing the RBC deformability under varying osmolarities. The EI is plotted against osmolarity for HbAA, HbSS, and HbSC RBCs, 3 samples per group. The curves illustrate the deformability of RBCs, with maximal EI occurring at iso-osmolar conditions and shifting left for dehydrated cells (xerocytosis). (H) Osmoscan curves for hRBCs under varying osmolar conditions. (I) Oxyscan curves of mRBCs in HbAA (n = 6), HbSC (n = 10), and HbSS (n = 5). (J) Oxyscan curves of hRBCs in HbAA (n = 3), HbSC (n = 10), and HbSS (n = 8). (K) Ohyper in mRBCs indicates the osmolarity in the hyperosmolar region at which the RBCs achieve half of their maximal elongation. (L) The PoS, defined as the pO2 at which a >5% decrease in EI is observed during deoxygenation, indicating the onset of sickling in mRBCs. (M) Ohyper in hRBCs. (N) PoS in hRBCs. For panels K through N: each symbol represents an individual sample, and bars represent mean ± standard error of the mean. Statistics were performed using ANOVA. ∗∗P < .01; ∗∗∗∗P < .00001. mOsm, milliosmoles.
Figure 3.
Figure 3.
Effects of H/R on hematological features, endothelial activation, inflammation, and HbSC RBC hydration. Mice were exposed to 8% oxygen for 10 hours in a hypoxia chamber, followed by 2 hours of reoxygenation in ambient air. (A) RBC counts (A), Hb concentration (g/dL; B), hematocrit (%; C), platelets (D), sVCAM-1 concentration (ng/mL; E), and Tumor necrosis factor α (TNF-α; picograms per milliliter; F) levels in the plasma, before hypoxia and after H/R. (G) Average osmoscan ektacytometry curves before and after H/R are shown. (H) Ohyper, the osmolarity in the hyperosmolar region at which the RBCs achieve half of their maximal elongation for the data in panel G, is shown. Each symbol in the bar diagrams represents an individual mouse, and the bars represent mean ± standard error of the mean. Statistics were performed using ANOVA. ∗P < .05; ∗∗P < .01; ∗∗∗P < .001; ∗∗∗∗P < .00001. Representative SEM images of RBCs after hypoxia in HbSC (I) and HbSS (J). The specimens were imaged using a Zeiss FE-SEM (Supra 35 VP) at 3 keV with a working distance of 2.9 mm using the Inlens detector. The magnification scale is shown within the micrographs and insets. Conc., concentration; mOsm, milliosmoles; ns, not significant; Post, after H/R; Pre, before hypoxia; sVCAM-1, soluble VCAM-1; TNF-α, tumor necrosis factor α.
Figure 4.
Figure 4.
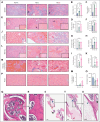
Histopathological evaluation of multiple organs of 7-month-old HbSC mice. (A) Representative histological spleen sections stained with hematoxylin and eosin (H&E) of HbAA (right), HbSC (middle), and HbSS (left). Black arrows point to expanded red pulps with congested sinusoids, original magnification ×100. (B) Spleen-to-body-weight ratio. Scoring of splenic red pulp congestion (C) and atrophy of white pulps based on pathology scoring of the spleen (D; supplemental Table 1). (E) Representative H&E pictures of liver sections illustrating congestion (black arrows), and areas of infarcts (blue arrows), original magnification ×200. Insets showing Prussian blue staining for each group. (F) Liver-to-body-weight ratio. Scoring of hemosiderin (G), the liver congestion (H), and portal inflammation (I) based on pathology scoring of the liver (supplemental Table 2). Representative Masson trichrome staining of liver sections (original magnification ×400; J) and liver fibrosis scoring (K), see more details in (supplemental Table 2). (L) Representative H&E pictures of kidney sections with insets showing Prussian blue staining for each group (original magnification ×200). (M) Iron deposition in the renal tubes based on pathology scoring of the kidney (supplemental Table 3). (N) Representative Masson trichrome staining of kidney sections (original magnification ×400). (O) Urine osmolarity, 6 hours; mice were 6 months old in this test. (P) Representative H&E pictures of heart sections (original magnification ×400), with insets showing original magnification ×20. Statistics were performed using ANOVA. ∗P < .05; ∗∗P < .01; ∗∗∗P < .001; ∗∗∗∗P < .00001. (Q) Representative H&E-stained bone and femoral sections of 1-year-old HbAA (n = 3), HbSC (n = 3), and HbSS (n = 5) with normal bone architecture and hematopoietic marrow (R) with intact osteocytes occupying the lacunae. (S-U) One abnormal mouse from HbSS group. The SCD mouse exhibits features of bone pathology, including coagulative necrosis of the bone marrow and local bone infarction, characterized by empty osteocyte lacunae (highlighted inset). wt, weight.
Figure 5.
Figure 5.
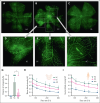
Sickle retinopathy in HbSC mice. Retinal vasculature was visualized after IV fluorescein isothiocyanate-dextran injections in 7-month-old AA, SC, and SS mice, and images were captured after dissection of the retina by a Nikon C2 confocal laser scanning microscope. Representative images of the retina in AA (A), SC (B), and SS (C) are shown. (D-F) Magnifications of the boxed areas from panel B (HbSC retina) show the neovascularization and abnormal blood vessel growth, “comma”-shaped vessels, and vascular leakage. (G) Percentage of mice with retinopathy (n = 6 in the SC and SS groups, n = 3 in the AA group of mice). No AA mice had retinopathy. Statistics were performed using ANOVA. ∗P < .05. Whole-blood viscosity in mice (H) and human samples (I) is shown at 5 different shear rates. Each line represents the mean + standard error of the mean of 3 to 6 mice or human blood samples per group. cP, centipoise.
Figure 6.
Figure 6.
Non-HbF effects of HU on HbSC RBC parameters and rheology. Adult SC and SS mice, 10 to 12 weeks of age, were treated with HU, 50 mg/kg (HU-50), or PBS (HU-0) intraperitoneally, 3 times a week for 4 weeks, and the peripheral blood was analyzed. (A) White blood cell counts. (B) No upregulation of HbF was observed both by HPLC or F-cell staining. The Hb subtypes, determined by HPLC, are shown in stacked bars (inset), and the F-cell percentage by flow cytometry is also shown. Panels C through J show RBC characteristics of HbSC mice that received HU-0 and HU-50, whereas similar data on HbSS mice are shown in supplemental Figure 5. (C) MCHC in the erythrocytes of HbSC mice is shown in the left panel, and the CHCMRetic in the right panel. (D) RBC deformability (EI), determined at normoxia across a range of shear stresses, is shown. (E) Sickling kinetics of the HbSC RBCs were analyzed using oxygen-scan ektacytometry at constant shear stress, and EI was measured with increasing hypoxia, followed by reoxygenation. The average RBC deformability curves of each group are shown. The pO2 PoS determined from these curves is shown in the inset. (F) Reactive oxygen species in HbSC and HbSS RBCs treated with HU-50 or HU-0 were analyzed by DCFDA staining and flow cytometry. The relative MFI, normalized to HU-0 group, is shown. (G) The percentage of Heinz-body–positive RBCs in HbSC and HbSS RBCs treated with HU-50 or HU-0 is shown. A minimum of 600 RBCs was counted per group. Representative pictures of the original blood smears with RBCs stained for Heinz bodies and controls are shown in supplemental Figure 8C-D. Unmodified peptide abundance (no trioxide; H) and cysteine-93 peptide abundance (I) was measured in 110 000 ghost RBCs from HbSC and HbSS mice treated with HU-50 or HU-0 based on trypsin digestion and comparative profiling by mass spectrophotometry. (J) Immunofluorescence imaging of ferryl Hb in RBCs from HbSC mice HU-0 (top) or HU-50 (bottom). Anti–ferryl Hb (green) and Ter119 (blue) staining were visualized on an EVOS 7000 (ThermoFisher Scientific) using a 60× coverslip-corrected objective (Olympus) and analyzed in the EVOS analysis software (ThermoFisher Scientific). Scale bar, 10 μm. For panels A through C, and F and G: each symbol represents an individual sample, and bars represent mean ± standard error of the mean. Curves in panels D through E represent average values of 3 to 4 mice per group. Statistics were performed using ANOVA. ∗P < .05; ∗∗P < .01; ∗∗∗∗P < .00001. DCFDA, 5′,6′-chloromethyl-2′,7′-dichlorodihydrofluorescein diacetate; MFI, mean fluorescence intensity.
Figure 7.
Figure 7.
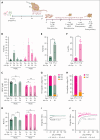
HbF differentially affects HbSC RBC parameters, improving HbSC RBC hydration at low levels and ameliorating sickling at modest levels. (A) Experimental design for panels B through F. HbSC female mice were time-mated with HbSS male mice to get a ∼50:50 ratio of HbSS and HbSC pups. Pregnant females were treated with 25 mg/kg BW HU by oral gavage from day 15 through day 21 of gestation. All pups born from the HU-treated pregnant females were treated with HU 50 mg/kg BW intraperitoneally (IP), 3 days per week for 8 weeks (HU-50 group). Control pregnant females and pups received the same volume of PBS by oral gavage or IP injections, respectively (HU-0 group). A limited amount of blood was collected pragmatically to allow serial analysis on the same set of mice. Hence, microbleeds were done at the indicated time points for quantifying F cells by flow cytometry. When the pups were 4 and 8 weeks old, blood was collected for both F-cell and CBC analyses. The data from these experiments are shown in panels B through F. Experimental design for panels G through I: in 1 experiment, we euthanized pups at P7 to P8 to obtain sufficient blood for HPLC, F cell, and oxygen-gradient ektacytometry. (B) Percent F cells determined using flow cytometry are shown at different ages indicated on the X-axis. (C-D) CBC analysis performed at 4 and 8 weeks is shown. The MCHC (C) and MCV (D)are shown. Percent F cells in 7-to-8-day-old HbSC pups (E) and HbSS (F) treated with the HU-0 and HU-50 groups, determined by flow cytometry, are shown. The HbF, HbC, and HbS percentage by HPLC analysis on the P7 to P8 pups in HbSC (G) and HbSS (H) are shown. Oxygen-gradient ektacytometry performed on the P7 to P8 pups HbSC (I) and HbSS (J) mice treated with HU-0 or HU-50. The PoS is shown on the curve. Each symbol represents an individual mouse, and the bars represent mean ± standard error of the mean. The oxygen-gradient ektacytometry curves represent the means of 3 mice per group. Statistics were performed using ANOVA. ∗∗P < .01; ∗∗∗P < .0001; ∗∗∗∗P < .00001. CBC, complete blood count; d, day; Gp, group; w or wk, week.

Comment in

References

    1. GBD 2021 Sickle Cell Disease Collaborators Global, regional, and national prevalence and mortality burden of sickle cell disease, 2000-2021: a systematic analysis from the global burden of disease study 2021. Lancet Haematol. 2023;10(8):e585–e599. - PMC - PubMed
    1. Serjeant GR, Vichinsky E. Variability of homozygous sickle cell disease: the role of alpha and beta globin chain variation and other factors. Blood Cells Mol Dis. 2018;70:66–77. - PubMed
    1. da Guarda CC, Yahouédéhou S, Santiago RP, et al. Sickle cell disease: a distinction of two most frequent genotypes (HbSS and HbSC) PLoS One. 2020;15(1) - PMC - PubMed
    1. Saraf SL, Molokie RE, Nouraie M, et al. Differences in the clinical and genotypic presentation of sickle cell disease around the world. Paediatr Respir Rev. 2014;15(1):4–12. - PMC - PubMed
    1. Segbefia C, Luchtman-Jones L, Seeing haemoglobin SC. Challenging the misperceptions. Br J Haematol. 2024;205(2):404–405. - PubMed

MeSH terms