. 2025 May 5;16(1):4174.
doi: 10.1038/s41467-025-59026-4.

Acoustofluidic bioassembly induced morphogenesis for therapeutic tissue fabrication

Affiliations

Acoustofluidic bioassembly induced morphogenesis for therapeutic tissue fabrication

Byungjun Kang et al. Nat Commun. .

Abstract

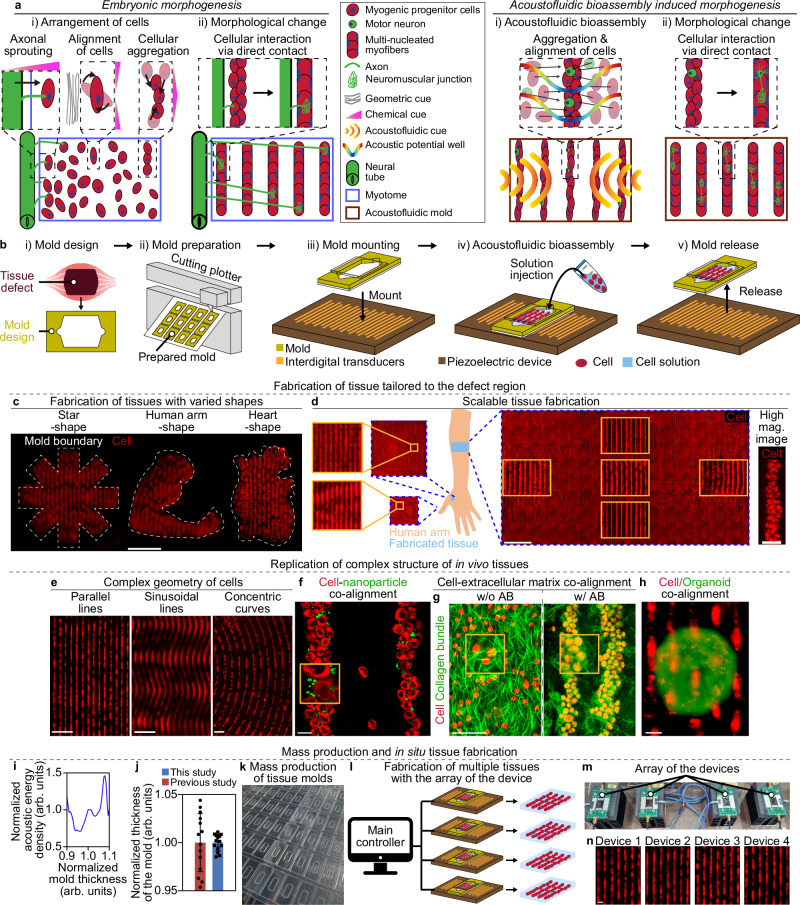
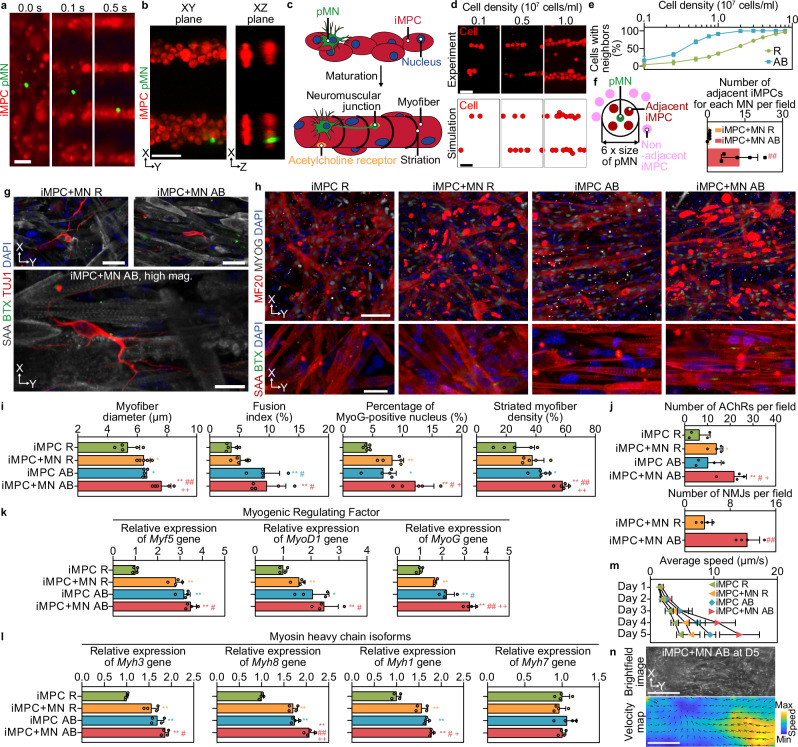
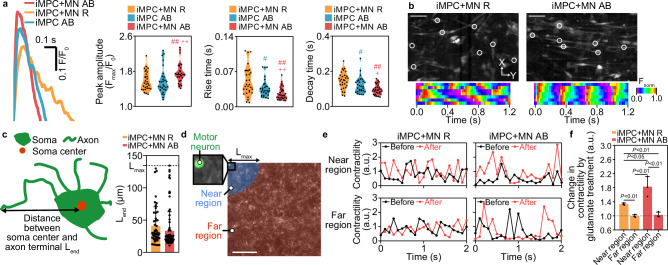
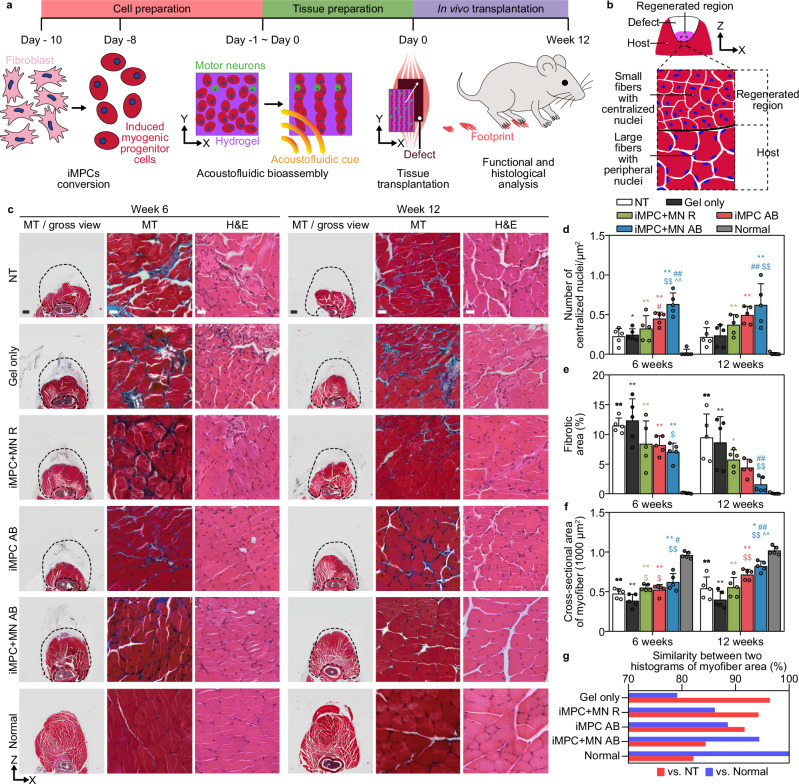
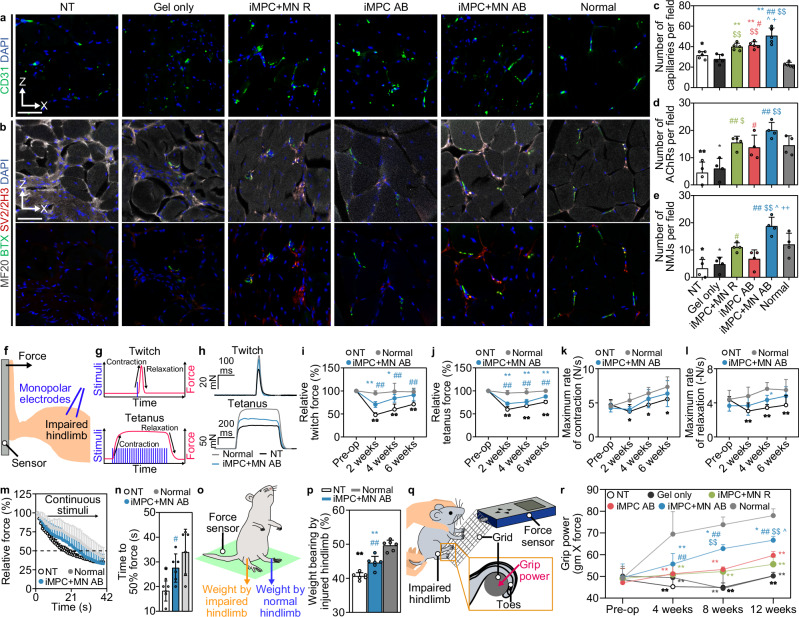
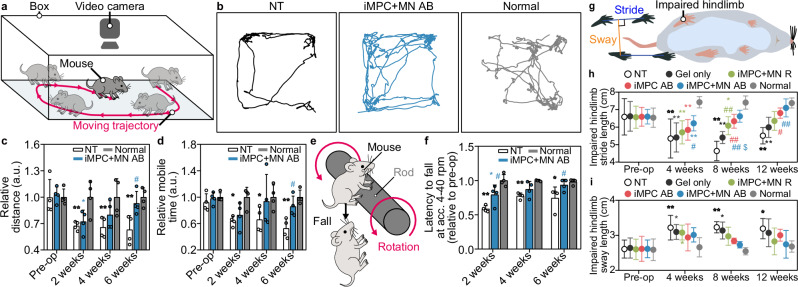
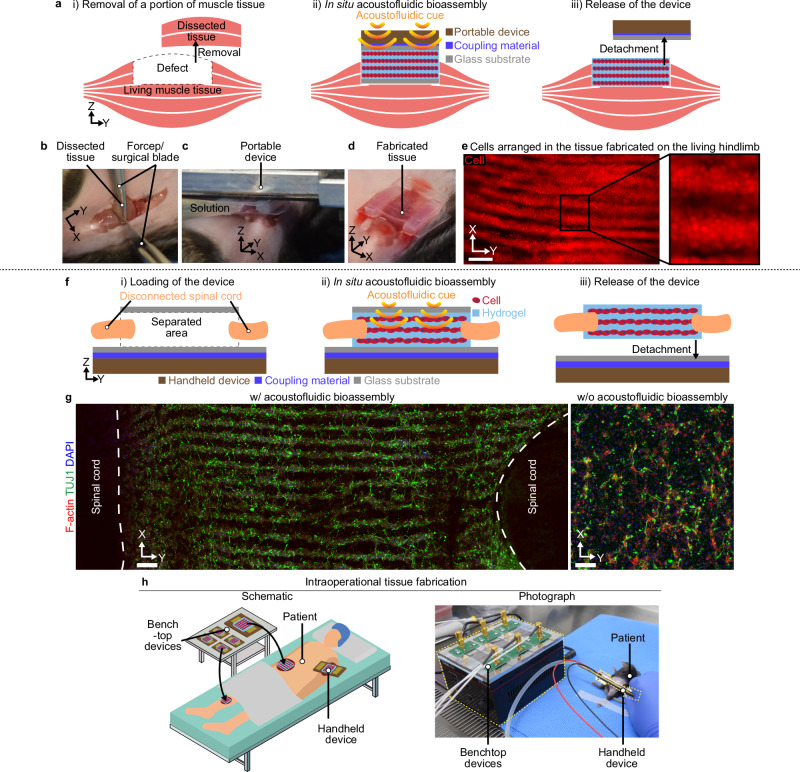
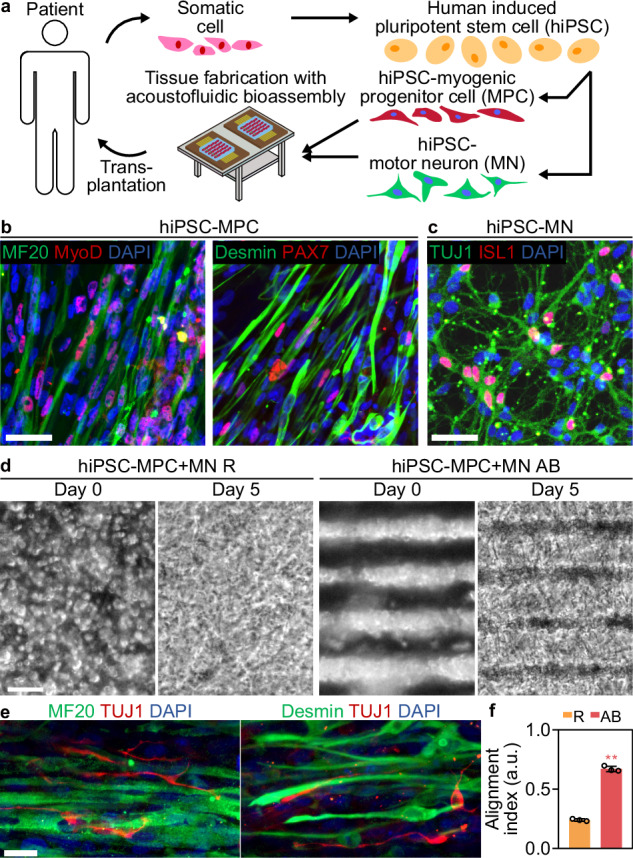
To build in vitro tissues for therapeutic applications, it is essential to replicate the spatial distribution of cells that occurs during morphogenesis in vivo. However, it remains technically challenging to simultaneously regulate the geometric alignment and aggregation of cells during tissue fabrication. Here, we introduce the acoustofluidic bioassembly induced morphogenesis, which is the combination of precise arrangement of cells by the mechanical forces produced by acoustofluidic cues, and the morphological and functional changes of cells in the following in vitro and in vivo cultures. The acoustofluidic bioassembly can be used to create tissues with regulated nano-, micro-, and macro-structures. We demonstrate that the neuromuscular tissue fabricated with the acoustofluidic bioassembly exhibits enhanced contraction dynamics, electrophysiology, and therapeutic efficacy. The potential of the acoustofluidic bioassembly as an in situ application is demonstrated by fabricating artificial tissues at the defect sites of living tissues. The acoustofluidic bioassembly induced morphogenesis can provide a pioneering platform to fabricate tissues for biomedical applications.


Conflict of interest statement

Competing interests: S.-W.C. is a chief technology officer (CTO) of Cellartgen, Inc., Republic of Korea. The remaining authors declare no competing interests.

Figures

Fig. 1
Fig. 1. Fabrication of functional tissue constructs with the acoustofluidic bioassembly method.
a Schematic of the cellular arrangement during embryonic (left) and acoustofluidic bioassembly (AB)-induced morphogenesis (right) in the neuromuscular tissues. Cellular morphogenesis followed by the acoustofluidic bioassembly can be conducted during in vitro or in vivo culture. b Schematic of the tissue fabrication using acoustofluidic bioassembly. c Fluorescent images of cells (red) arranged in a regular parallel line pattern in the tissue construct fabricated using the tissue molds having geometries including star, human arm, and heart. Scale bar represents 1 mm. White dotted lines represent the tissue mold boundary. d Schematic of fabricated tissue constructs in the mold placed on the human arm and a tile-scan fluorescent image of cells (red) of the entire tissue construct, and high-mag. image of cell aggregates at the center region. Scale bars in the tile scan and high-mag. images represent 5 mm and 50 μm. e Fluorescent images of cells arranged into parallel and sinusoidal lines, and concentric curves. Scale bars represent 0.5 mm. f Fluorescent image of cells (red) co-arranged with polystyrene polymer nanoparticles (green). Scale bars represent 20 μm. g Fluorescent images of cells (red) and collagen bundles (green) in the tissues fabricated without (w/o) and with (w/) the AB. Scale bar represents 100 μm. h Fluorescent image of cells (red) co-arranged with organoid (green). Scale bar represents 100 μm. i Numerical analysis of the normalized acoustic energy density as the function of the normalized mold thickness. j Normalized thickness of the tissue molds in the previous and this study (n = 14 independent samples). Error bars represent a standard deviation. k Photograph of the mass production of the tissue molds. l Schematic of the fabrication of multiple tissues with the array of the tissue fabrication devices. m Photograph of the array of the devices. n Fluorescent images of cells (red) arranged at each device. Scale bars represent 100 μm. Inset images within the solid orange rectangle in (d) and (f), and (g) have been enlarged by 700%, 200%, and 200% in length, respectively. Source data are provided as a Source Data file.
Fig. 2
Fig. 2. Effects of the acoustofluidic bioassembly on the maturation of neuromuscular tissue.
a, b Time-lapse (a) and maximum intensity projection (b) fluorescent images of induced myogenic progenitor cells (iMPCs; red) and primary motor neurons (pMNs; green) under the acoustofluidic bioassembly (AB). Scale bar represents 50 μm. c Schematic of the neuromuscular junction (NMJ) formation in the iMPCs and MNs after the AB. d Cellular distribution after the AB in the experiment and the simulation at various cell densities. Scale bars represent 50 μm. e Numerical analysis of percentage of cells having neighbors in the tissue without (Random; R) and with the AB (n = 30 independent trials). f Number of adjacent iMPCs per each pMN for iMPC+MN R and iMPC+MN AB groups (n = 5). g Immunostaining images of SAA (gray)/BTX (green)/TUJ1 (red)/DAPI (blue) of iMPC+MN R and iMPC+MN AB groups. Scale bars in the upper and lower images represent 40 μm and 20 μm, respectively. h Immunostaining images for MF20 (red)/MyoG (gray)/DAPI (blue) (top) and SAA (red)/BTX (green)/DAPI (blue) (bottom) on day 5. Scale bars in the top and bottom row images represent 100 μm and 20 μm, respectively. i Average myofiber diameter, fusion index, percentage of MyoG-positive nucleus, and striated myofiber density (n = 5 biologically independent samples). j Number of AChRs and NMJs (n = 4 biologically independent samples). k, l qRT-PCR analysis of myogenic regulatory factors (k) and myosin heavy chain isoforms (l) on day 5 of iMPC R, iMPC+MN R, iMPC AB, and iMPC+MN AB groups (n = 4 biologically independent samples). m Average cellular speed during spontaneous contraction on days 1, 2, 3, 4, and 5 (n = 4 biologically independent samples). n Representative phase-contrast image (top) and velocity map (bottom) in iMPC+MN AB on day 5. Scale bars represent 100 μm. All data are presented as mean ± S.D., and statistical differences were determined with an unpaired, two-sided t-test. *P < 0.05 and **P < 0.01 versus iMPC R, #P < 0.05 and ##P < 0.01 versus iMPC+MN R, and +P < 0.05 and ++P < 0.01 versus iMPC AB. Source data are provided as a Source Data file.
Fig. 3
Fig. 3. Electrophysiology characterization for neuromuscular tissue fabricated using acoustofluidic bioassembly technique.
a Representative time-dependent calcium intensity of cells normalized by initial values (F/F0), peak amplitude, and rise and decay time of the calcium signal in iMPC AB, iMPC+MN R, and iMPC+MN AB groups (n = 30). b Representative fluorescent images of Fluo-4 AM and normalized calcium intensity Fnorm of cells in the regions delineated with white solid marks during the spontaneous contraction in iMPC+MN R and iMPC+MN AB groups. Scale bars represent 100 μm. c Schematic and the image-based analysis of the distance between soma center and axon terminal of motor neurons (Lend) in the iMPC+MN R and iMPC+MN AB group (n = 47 for iMPC+MN R and n = 62 for iMPC+MN AB). d Overlay of the brightfield image of the iMPC+MN R and the fluorescent image of a membrane-stained motor neuron, with the definition of the near and far region. Scale bar represents 50 μm. e Representative contractility of cells in near and far regions of iMPC+MN R and iMPC+MN AB group before and after the glutamate treatment. Contractility values were normalized to the average one before the glutamate treatment. f Change in contractility of cells in near and far regions of iMPC+MN R and iMPC+MN AB groups after glutamate treatment (n = 3 biologically independent samples). a.u., arbitrary units. All data are presented as mean ± S.D., and statistical differences were determined with an unpaired, two-sided t-test. *P < 0.05 and **P < 0.01 versus iMPC R, #P < 0.05 and ##P < 0.01 versus iMPC+MN R, and +P < 0.05 and ++P < 0.01 versus iMPC AB. Source data are provided as a Source Data file.
Fig. 4
Fig. 4. Transplantation of neuromuscular tissues fabricated by acoustofluidic bioassembly method for volumetric muscle loss.
a Schematic diagram and timeline of production and implantation of 3D neuromuscular tissue generated by acoustofluidic bioassembly (AB). b Schematic of muscle fibers in the defect, regenerated region, and host region in the cross-section of skeletal muscle. In normal skeletal muscle (host), the nuclei of muscle fibers are located at the periphery of the muscle fiber. Myofibers with central nuclei are observed in the regenerated region. c Representative images of Masson’s trichrome (MT) and Hematoxylin and eosin (H&E) stained cross-sections of volumetric muscle loss (VML)-injured quadriceps muscles at 6 and 12 weeks after. Black dotted lines in gross view represent the host regions before ablation. Scale bars in gross view and microscopic image represent 500 μm and 20 μm, respectively. df Quantitative analysis of the number of centralized nuclei (d), fibrotic area (e), and the average cross-sectional area (CSA) of myofiber (f) based on MT staining images (n = 5 biologically independent samples). g Similarity of the histograms of CSA of myofibers of gel only, iMPC+MN R, iMPC AB, or iMPC+MN AB groups versus (vs.) those of NT or normal groups. All data are presented as mean ± S.D., and statistical differences were determined with one-way ANOVA followed by Tukey’s test. #P < 0.05 and ##P < 0.01 versus NT, $P < 0.05 and $$P < 0.01 versus gel, ^^P < 0.01 versus iMPC+MN R, and *P < 0.05 and **P < 0.01 versus Normal. Source data are provided as a Source Data file.
Fig. 5
Fig. 5. Functional restoration using transplanted tissues formed with acoustofluidic bioassembly.
a, b Immunostaining images of CD31 (green) and DAPI (blue) (a) and MF20 (gray), BTX (green), SV2/2H3 (red), and DAPI (blue) (b) of injured muscles at 12 weeks. The bottom rows in (b) are the merged images without MF20. Scale bars represent 50 μm. ce Number of capillaries (c) (n = 5), AChRs (d) (n = 4), and NMJs (e) (n = 4) per field. f Schematic of the force measurement of the impaired muscle using electrical stimuli from electrodes. gh Schematic of the force (red) made by electrical stimuli (blue) (g) and representative force plots during the twitch and tetanic behavior (h). il Twitch (i) and tetanic (j) force, maximum rate of contraction (k) and relaxation (l) at pre-operation (Pre-op) and 2, 4, and 6 weeks (n = 6 biologically independent samples). The forces were normalized by values at Pre-op. m, n Force decay during tetanic stimulation (m) and time required to reach 50% of the initial values (n) at 6 weeks (n = 6 biologically independent samples). o Schematic of the weight-bearing analysis. p Weight bearing ratio of the injured to the uninjured hindlimb in the NT, iMPC+MN AB, and Normal groups at 6 weeks (n = 6 biologically independent samples). q Schematic of the grip strength test. r Grip strength at Pre-op and 4, 8, and 12 weeks (n = 9 biologically independent samples for NT, gel, and Normal, and n = 10 biologically independent samples for other groups at Pre-op and 4 weeks; n = 4 biologically independent samples for NT, gel, iMPC+MN R, and iMPC+MN AB and n = 5 biologically independent samples for other groups at 8 and 12 weeks). All data are presented as mean ± S.D. Statistical differences in (c), (d), (e), (n) and (p) were determined with a one-way ANOVA followed by Tukey’s test, and those in (i), (j), (k), (l), and (r) were determined with a two-way ANOVA followed by Tukey’s test. #P < 0.05 and ##P < 0.01 versus NT, $P < 0.05 and $$P < 0.01 versus gel, ^P < 0.05 versus iMPC+MN R, +P < 0.05 and ++P < 0.01 versus iMPC AB, and *P < 0.05 and **P < 0.01 versus Normal. Source data are provided as a Source Data file.
Fig. 6
Fig. 6. Behavioral restoration with transplanted tissues formed with acoustofluidic bioassembly.
a Schematic of open field analysis. b Representative plots of the moving trajectories of the mice at 6 weeks in the open field tests. cd Relative distance (c) and relative mobile time (d) of the mice at pre-operation (Pre-op), 2, 4, and 6 weeks (n = 4). e Schematic of rotarod assay. f Latency to fall at acceleration (acc.) from 4 to 40 rpm of the mice at 2, 4, and 6 weeks normalized to values at Pre-op obtained from the rotarod assay (n = 4). g Schematic illustration of quantification of sway and stride in the gait analysis for the hindlimbs. hi Measurements of injured hindlimb stride length (h) and sway length (i) at Pre-op, 4, 8, and 12 weeks post-implantation with 3D fabricated neuromuscular tissues (n = 9 biologically independent samples for Normal and n = 10 biologically independent samples for all other groups at Pre-op and 4 weeks; n = 5 biologically independent samples at 8 and 12 weeks). a.u., arbitrary units. All data are presented as mean ± S.D. Statistical differences were determined with a two-way ANOVA followed by Tukey’s test. #P < 0.05 and ##P < 0.01 versus NT, $P < 0.05 versus gel, and *P < 0.05 and **P < 0.01 versus Normal. Source data are provided as a Source Data file.
Fig. 7
Fig. 7. In situ acoustofluidic bioassembly.
ae In situ applications of acoustofluidic bioassembly for muscle regeneration. (a) Schematic of the in situ acoustofluidic bioassembly for tissue fabrication on live skeletal muscle tissue with volumetric muscle loss. bd Photographs of volumetric muscle loss induced by dissecting a portion of muscle tissue of the quadriceps femoris with forceps and surgical blades (b), portable acoustofluidic device loaded on the target site and injection of the cell-hydrogel solution to the target location (c), and muscle tissue fabricated on the defect site of the mouse hindlimb (d). e Fluorescent images of the cells (red) arranged into three-dimensional and parallel cylinders in the tissue fabricated on live muscle. Scale bar represents 200 μm. f, g In situ application of acoustofluidic bioassembly for regeneration of disconnected spinal cord. f Schematic of the in situ acoustofluidic bioassembly for tissue fabrication between the disconnected spinal cord. g Immunostaining images of F-actin (red)/TUJ1 (green)/DAPI (blue) of human induced pluripotent stem cell-derived neural progenitor cells (hiPSC-NPCs) in the tissues fabricated with (w/) and without (w/o) acoustofluidic bioassembly on day 5. The tissues were fabricated between the disconnected ex vivo spinal cords. White dotted lines represent the boundaries of the spinal cord tissues. Scale bars represent 100 μm. h Photograph and schematic of the benchtop array of devices placed near the patient and a handheld device placed on the patient inside the clean bench.
Fig. 8
Fig. 8. Construction of the neuromuscular tissues using human induced pluripotent stem cell (hiPSC)-derived myogenic progenitor cells (MPCs) and motor neurons (MNs).
a Schematic of strategies in personalized tissue fabrication with acoustofluidic bioassembly using hiPSC-derived MPCs and MNs. b Immunofluorescence images of hiPSC-derived MPCs after differentiation, stained with MF20 (green)/MyoD (red)/DAPI (blue) and Desmin (green)/PAX7 (red)/DAPI (blue). c Immunofluorescence image of TUJ1 (green)/ISL1 (red)/DAPI (blue) of hiPSC-derived MNs after differentiation. d Brightfield images of the neuromuscular tissues of hiPSC-MPC + MN R and hiPSC-MPC + MN AB groups at day 0 and 5. e Immunofluorescence images of the tissues of the hiPSC-MPC + MN AB groups at day 5 stained with MF20 (green)/TUJ1 (red)/DAPI (blue) and desmin (green)/TUJ1 (red)/DAPI (blue). f Alignment index of the cells in the hiPSC-MPC + MN R (R) and hiPSC-MPC + MN AB (AB) groups at day 5 (n = 3 biologically independent samples; **P < 0.01 versus R). a.u., arbitrary units. Scale bars in (be) represent 50 μm, 50 μm, 100 μm, and 25 μm, respectively. Data is presented as mean ± S.D., and statistical differences were determined with an unpaired, two-sided t-test. Source data are provided as a Source Data file.

Similar articles

References

    1. Ingber, D. E. Human organs-on-chips for disease modelling, drug development and personalized medicine. Nat. Rev. Genet.23, 467–491 (2022). - PMC - PubMed
    1. Monteiro, M. V., Zhang, Y. S., Gaspar, V. M. & Mano, J. F. 3D-bioprinted cancer-on-a-chip: level-up organotypic in vitro models. Trends Biotechnol.40, 432–447 (2022). - PMC - PubMed
    1. Fatehullah, A., Tan, S. H. & Barker, N. Organoids as an in vitro model of human development and disease. Nat. Cell Biol.18, 246–254 (2016). - PubMed
    1. Mota, C., Camarero-Espinosa, S., Baker, M. B., Wieringa, P. & Moroni, L. Bioprinting: from tissue and organ development to in vitro models. Chem. Rev.120, 10547–10607 (2020). - PMC - PubMed
    1. Gupta, A., Lutolf, M. P., Hughes, A. J. & Sonnen, K. F. Bioengineering in vitro models of embryonic development. Stem Cell Rep.16, 1104–1116 (2021). - PMC - PubMed

LinkOut - more resources