. 2025 May 6;11(1):44.
doi: 10.1038/s41421-025-00777-1.

A basigin antibody modulates MCTs to impact tumor metabolism and immunity

Affiliations

A basigin antibody modulates MCTs to impact tumor metabolism and immunity

Heng Zhang et al. Cell Discov. .

Abstract

Lactate metabolism and signaling intricately intertwine in the context of cancer and immunity. Basigin, working alongside monocarboxylate transporters MCT1 and MCT4, orchestrates the movement of lactate across cell membranes. Despite their potential in treating formidable tumors, the mechanisms by which basigin antibodies affect basigin and MCTs remain unclear. Our research demonstrated that basigin positively modulates MCT activity. We subsequently developed a basigin antibody that converts basigin into a negative modulator, thereby suppressing lactate transport and enhancing anti-tumor immunity. Additionally, the antibody alters metabolic profiles in NSCLC-PDOs and T cells. Cryo-EM structural analysis and molecular dynamics simulations reveal that the extracellular Ig2 domain and transmembrane domain of basigin regulate MCT1 activity through an allosteric mechanism. The antibody decreases MCT1 transition rate by reducing the flexibility of basigin's Ig2 domain and diminishing interactions between basigin's transmembrane domain and MCT1. These findings underscore the promise of basigin antibodies in combating tumors by modulating metabolism and immunity, and the value of a common therapeutic subunit shared by multiple transporter targets.


Conflict of interest statement

Conflict of interest: ShanghaiTech University has filed a patent application on behalf of the authors regarding the antibody sequence and applications. Jun Liao is a founder of Alphelix Biosciences and a member of its scientific advisory board.

Figures

Fig. 1
Fig. 1. mBSG accelerates MCT-mediated H+/monocarboxylate symport.
a Transport activities of mMCT1 and mMCT1/mBSG in the presence of test anions. Transport activities are determined using the liposomal flux assay, in which normalized fluorescence quenching of the pH-sensitive dye, HPTS, is measured. Data are scaled to the normalized fluorescence quenching of WT mMCT1/mBSG in the presence of 25 mM extraliposomal pyruvate, pH 7.0 (a, c), or the normalized fluorescence quenching of WT mMCT4/mBSG in the presence of 25 mM extraliposomal L-lactate, pH 7.0 (b, d). “Empty” refers to control protein-free liposomes. All test anions are sodium salts. b Transport activities of mMCT4 and mMCT4/mBSG in the presence of test anions. c mMCT1- or mMCT1/mBSG-mediated H+/pyruvate influx in response to different extraliposomal pyruvate concentrations. d mMCT4- or mMCT4/mBSG-mediated H+/L-lactate influx in response to different extraliposomal L-lactate concentrations. e mMCT1- or mMCT1/mBSG-mediated H+/pyruvate influx in response to 6E7F1, and/or AZD3965. Intraliposomal buffer: 150 mM NaCl, 0.1 mM HPTS, 20 mM Tris, pH 8.5; extraliposomal buffer: 150 mM NaCl, 25 mM sodium pyruvate, 20 mM HEPES, pH 7.0. IgG and/or DMSO are controls for 6E7F1 and/or AZD3965, respectively.
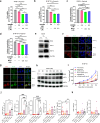
Fig. 2
Fig. 2. 6E7F1 converts mBSG into a negative MCT modulator, suppressing tumor growth and enhancing T cell immunity.
a, b Viability of human A549 lung carcinoma (a) and murine B16F10 melanoma (b) cells under hypoxia (1% O2) treated with 6E7F1 and/or AZD3965. c, d Extracellular lactate concentrations in cultured A549 (c) and B16F10 (d) cells under hypoxia, treated with 6E7F1 and/or AZD3965. e Western blot analysis of BSG, MCT1, and MCT4 protein levels in A549 cells under both normoxic and hypoxic conditions. f, g Immunofluorescent imaging reveals co-localization of BSG with MCT1 (f) and MCT4 (g) on the plasma membrane of A549 cells. h Western blot analysis of BSG, MCT1, and MCT4 protein levels in A549 cells under hypoxia with increasing concentrations of 6E7F1. i The effect of 6E7F1, AZD3965, and/or PD-1 antibody on B16F10 allograft tumor growth in immunocompetent C57BL/6 mice. j, k FACS analysis of tumor-infiltrating lymphocytes following specified administrations in immunocompetent C57BL/6 mice bearing B16F10 tumors.
Fig. 3
Fig. 3. BSG antibody 6E7F1 suppresses the growth of NSCLC-PDOs.
a Images of NSCLC-PDOs derived from four NSCLC patients (Pt 1, Pt 2, Pt 3, and Pt 4). Scale bars, 100 µm. b HE and IHC staining of NSCLC biopsies and their corresponding organoids. Pathological markers for IHC staining included CK7, TTF-1, NapsinA, and EpCAM. Scale bars, 50 µm. c Genetic variants identified in each sample based on WES analysis. The color reflects correlation. T: tumor tissue; O: organoid. d Sensitivity of the four NSCLC-PDOs to glycolysis inhibitors. The highest concentrations were up to 100 µM for small molecules and 0.6 µM for 6E7F1. Dead cells and living cells were stained by propidium iodide (PI, red) and Calcein-AM (green), respectively. e Heatmap depicting the responses of NSCLC-PDOs to drugs, including GSK2837808A, VB124, 6E7F1, and AZD3965. The color scale represents average LogIC50 values.
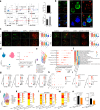
Fig. 4
Fig. 4. BSG antibody 6E7F1 modulates the metabolism of the NSCLC-PDOs and T cells.
a Representative FACS analysis of co-cultured tumor organoids and T cells on Day 12 (left panel) and the statistics of T cell composition (right panel). b Representative images of co-cultured tumor organoids and T cells. c Representative images of co-cultured NSCLC-PDOs and T cells (left panel) and the statistics of each PDO’s viability (right panel) under treatments with control phosphate-buffered saline (PBS), PD-1 antibody, 6E7F1, and a combination of the PD-1 antibody and 6E7F1. d, e UMAP plots illustrating cell types and classical marker genes for the co-cultured NSCLC-PDOs and T cells (d), as well as epithelial cells (e). f Heatmaps illustrating metabolic variation within epithelial groups under the specified treatments. g Dot plots displaying the transcriptional variation of SLC16A1 and SLC16A3 within epithelial groups under the specified treatments. h, i Dot plots showing the expressional variation of genes involved in the sphingolipid pathway (h) or the MCCC2 gene (i) within the epithelial groups under the specified treatments. j UMAP plot depicting various categories of T cells. k, l Heatmaps depicting the expression variability of genes in CD8+ T cells (k) and in CD8+GZMB+ T cells (l) under specified treatments. The Seurat indicates average gene expression. m Heatmap depicting the expression variability of genes in CD4+ T cells under specified treatments. n The population variation of CD4+TNFRSF8+ T cells (left panel) and CD4+ Treg cells (right panel) under specified treatments.
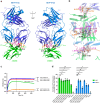
Fig. 5
Fig. 5. 6E7F1’s interactions with mBSG impact its ability to inhibit mMCT1/mBSG activity.
a Overview of the interaction between 6E7F1Fab and the Ig2 domain of mBSG. Three mBSG residues (D137, E149, and T197), each of which interact with multiple 6E7F1Fab residues, are marked. b Zoomed-in view of interactions between 6E7F1Fab residues and D137 (top), E149 (middle), and T197 (bottom) of mBSG. Cryo-EM density (grey, 5.0 σ) of interacting residues is shown. Red dashed lines represent H-bonds (bond length of 2.5–3.5 Å); black dashed lines indicate distances between two polar atoms (O or N) (3.6–4.5 Å). c The binding affinity of 6E7F1 to WT mMCT1/mBSG or mMCT1/mBSG variants measured by Octet biolayer interferometry. Purified 6E7F1 was immobilized on Anti-Mouse IgG Fc Capture biosensors. Each analyte is 200 nM. d The transport activity of mMCT1 affected by the binding affinity of 6E7F1 to WT mMCT1/mBSG and variants. Intraliposomal buffer: 150 mM NaCl, 0.1 mM HPTS, 20 mM Tris, pH 8.5; extraliposomal buffer: 150 mM NaCl, 25 mM pyruvate, 20 mM HEPES, pH 7.0.
Fig. 6
Fig. 6. The mechanism by which mBSG accelerates mMCT1 transition.
a Spontaneous evolution of the mMCT1/mBSG structure in a 1200 ns trajectory initiated with the outward-open mMCT1/mBSG. Analyses in bg are based on the same trajectory. b, c Representative snapshots from the MD trajectory of mMCT1/mBSG, showing two conformations: an outward-facing conformation (b) and a conformation with an inward-facing NTD and outward-facing CTD (c). The center-to-center distance between the Ig2 domain and mMCT1 is indicated by a grey dashed line. Zoomed-in views of the anchor (V206–M210) of mBSG are shown in the upper right insets for each model. d Time-evolved changes in the center-to-center distance between the Ig2 domain and mMCT1 (grey), and the number of H-bonds (green) within the anchor of mBSG over the trajectory. In df, individual data points are plotted as light, transparent traces, while average values are represented by bold traces. e, f Time-evolved changes in the angles of TM0 within mBSG (e), and TM3 and TM6 in the NTD of mMCT1 (f) relative to the membrane surface over the trajectory. The red arrow indicates the transition from an outward- to an inward-facing conformation. g Time-evolved changes of three sets of H-bonds over the trajectory. Shown are a representative snapshot of the simulation model (left), zoomed-in views (middle) of these H-bonds, and time-evolved changes (right) to the extracellular and intracellular H-bonds. h Validation of the impact of the Ig2 domain and H-bond interactions between mBSG’s TM0 and mMCT1’s NTD on mMCT1 transport activity. The mMCT1/mBSG_∆ variant has truncated mBSG with residues M1–L204.
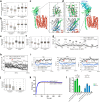
Fig. 7
Fig. 7. Mechanism by which 6E7F1 inhibits mMCT1.
a, b Boxplots of the proportion of β-strands within mBSG (a) and its I99–G119 segment (b) over trajectories. For boxplots in a, b, e, f and j, the box extends from the first quartile (Q1) to the third quartile (Q3) of the data, with an orange line at the median. The whiskers extend from the box by 1.5× inter-quartile range (IQR). Outliers beyond the extreme ends of the whiskers are represented as individual points. c, d Snapshots from trajectories for mMCT1/mBSG (c) and mMCT1/mBSG/6E7F1Fab (d). H-bond interactions between strands A and B (top) and between strands A′ and G (bottom) are highlighted in zoomed-in views. e, f Boxplots of the number of H-bonds between strands A and B (e), and between strands A′ and G (f) over trajectories. g RMSF values for the Cα atoms of residues in mBSG across the trajectories. h Changes in the center-to-center distance between the Ig2 domain and mMCT1 over the trajectories. In h and i, individual data points are plotted as light, transparent traces, while average values are represented by bold traces. The trajectory of mMCT1/mBSG marked by a red arrow in h and i corresponds to the same one in Fig. 6e, f. i Changes in the angles of TM0 in mBSG, TM3 and TM6 in the NTD of mMCT1 relative to the membrane surface over a representative trajectory. j Boxplots showing H-bonds between mBSG’s R207 and mMCT1’s NTD over the trajectories. k The binding affinities of 6E7F1 to both WT mMCT1/mBSG and the mMCT1/mBSG (K111A/K127A) variant measured by Octet biolayer interferometry. Purified 6E7F1 was immobilized on Anti-Mouse IgG Fc Capture biosensors. l The transport activities of mMCT1, WT mMCT1/mBSG, and mMCT1/mBSG (K111A/K127A) assessed in the absence or presence of 6E7F1.

References

    1. Vander Heiden, M. G., Cantley, L. C. & Thompson, C. B. Understanding the Warburg effect: the metabolic requirements of cell proliferation. Science324, 1029–1033 (2009). - PMC - PubMed
    1. Zhang, D. et al. Metabolic regulation of gene expression by histone lactylation. Nature574, 575–580 (2019). - PMC - PubMed
    1. Yang, Z. et al. Lactylome analysis suggests lactylation-dependent mechanisms of metabolic adaptation in hepatocellular carcinoma. Nat. Metab.5, 61–79 (2023). - PubMed
    1. Murray, C. M. et al. Monocarboxylate transporter MCT1 is a target for immunosuppression. Nat. Chem. Biol.1, 371–376 (2005). - PubMed
    1. Angelin, A. et al. Foxp3 reprograms T cell metabolism to function in low-glucose, high-lactate environments. Cell Metab.25, 1282–1293.e7 (2017). - PMC - PubMed

Grants and funding

LinkOut - more resources