

Diagnostic value of choroidal vascular density in predicting the progression of diabetic retinopathy
- PMID: 40325093
- PMCID: PMC12053639
- DOI: 10.1038/s41598-025-00528-y
Diagnostic value of choroidal vascular density in predicting the progression of diabetic retinopathy
Abstract
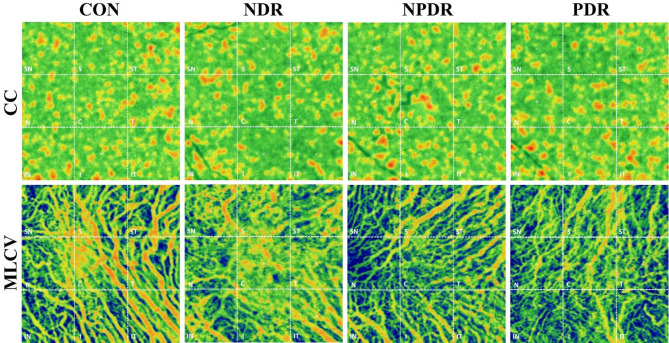
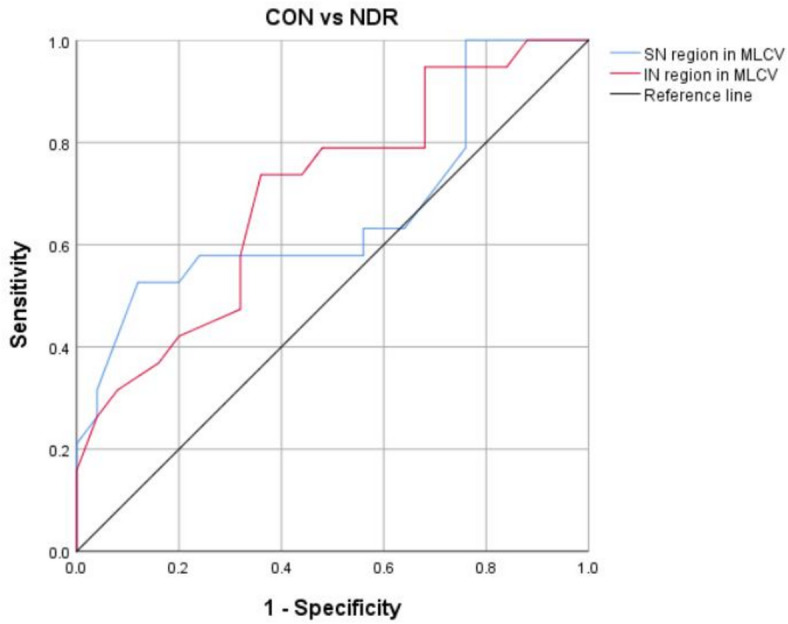
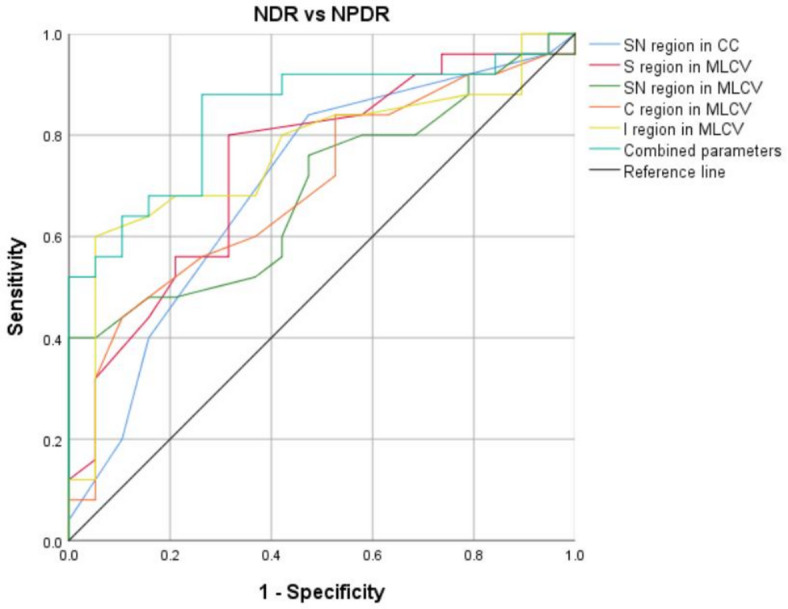
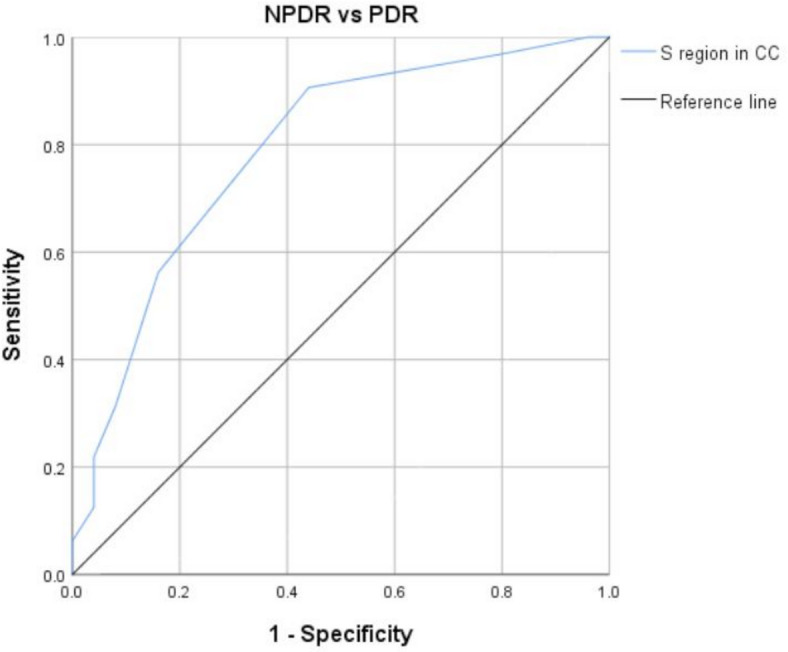
By utilizing widefield swept-source optical coherence tomography angiography (WSS-OCTA) to quantify choroidal vascular density (VD) in order to identify early fundus changes in diabetic patients and to predict the progression of diabetic retinopathy (DR). A total of 101 eyes, including patients with type 2 diabetes mellitus and controls, were included in the cross-sectional study. Diabetic patients were stratified into three groups based on disease severity: non-DR (NDR), nonproliferative DR (NPDR), and proliferative DR (PDR). Fundus images obtained through WSS-OCTA were segmented into nine 2 mm × 2 mm regions centered on the macula: supratemporal (ST), superior (S), supranasal (SN), temporal (T), central macular area (C), nasal (N), inferotemporal (IT), inferior (I), and inferonasal (IN). Changes in choroidal VD in the choriocapillaris (CC) and mid-large choroidal vasculature (MLCV) layers were evaluated in each region among patients with DR. Additionally, the diagnostic value of choroidal VD in distinguishing different stages of DR was assessed using the area under the receiver operating characteristic (ROC) curve. In comparison to the NDR group, the VD of MLCV (S) was found to decrease significantly in the NPDR group. Furthermore, the VD of CC (S) was significantly lower in the PDR group compared to the NPDR group. The VD of MLCV (IN) demonstrated potential in distinguishing between healthy eyes and those with NDR. Additionally, the VD of CC (SN) and MLCV (S, SN, C, I) showed relatively high area under the curve (AUC) values in discriminating between NDR and NPDR. Lastly, the VD of CC (S) exhibited good diagnostic accuracy in distinguishing between NPDR and PDR patients. As DR advances, MLCV and CC are sequentially compromised to varying degrees. In clinical diagnosis, the VD of the IN region in the MLCV layer serves as a more sensitive early imaging biomarker for detecting preclinical DR, while a decrease in the VD of the S region in the CC layer indicates the onset of PDR.
Keywords: Choroidal vascular density; Diabetes mellitus; Diabetic retinopathy; Receiver operating characteristic; Widefield swept-source optical coherence tomography angiography.
© 2025. The Author(s).
Conflict of interest statement
Declarations. Competing interests: The authors declare no competing interests. Ethical approval: The studies involving human participants were reviewed and approved by Ethics Committee of Qingdao Eighth People’s Hospital (No. QBYLL-KY-2024-002). The patients/participants provided their written informed consent to participate in this study.
Figures
Similar articles
-
Analysis of retinal and choroidal characteristics in patients with early diabetic retinopathy using WSS-OCTA.Front Endocrinol (Lausanne). 2023 May 24;14:1184717. doi: 10.3389/fendo.2023.1184717. eCollection 2023. Front Endocrinol (Lausanne). 2023. PMID: 37293481 Free PMC article.
-
Quantitative analysis of retinal and choroid capillary ischaemia using optical coherence tomography angiography in type 2 diabetes.Acta Ophthalmol. 2019 May;97(3):240-246. doi: 10.1111/aos.14076. Epub 2019 Feb 27. Acta Ophthalmol. 2019. PMID: 30810284
-
Interaction Between the Distribution of Diabetic Retinopathy Lesions and the Association of Optical Coherence Tomography Angiography Scans With Diabetic Retinopathy Severity.JAMA Ophthalmol. 2020 Dec 1;138(12):1291-1297. doi: 10.1001/jamaophthalmol.2020.4516. JAMA Ophthalmol. 2020. PMID: 33119083 Free PMC article.
-
Detection of choroidal vascular features in diabetic patients without clinically visible diabetic retinopathy by optical coherence tomography angiography: A systemic review and meta-analysis.Surv Ophthalmol. 2025 Jul-Aug;70(4):695-703. doi: 10.1016/j.survophthal.2024.08.007. Epub 2024 Aug 29. Surv Ophthalmol. 2025. PMID: 39214238
-
Evaluation of Posterior Ocular Blood Flow in Diabetic Retinopathy Patients Without Macular Edema Using Optical Coherence Tomography Angiography.Photodiagnosis Photodyn Ther. 2023 Dec;44:103777. doi: 10.1016/j.pdpdt.2023.103777. Epub 2023 Sep 3. Photodiagnosis Photodyn Ther. 2023. PMID: 37669724 Review.
References
-
- Williams, R. et al. Global and regional estimates and projections of diabetes-related health expenditure: Results from the international diabetes federation diabetes atlas, 9th edition. Diabetes Res. Clin. Pract.162, 108072 (2020). - PubMed
MeSH terms
Grants and funding
- No. 2024FYM063/the Science and Technology Development Project of Shandong Second Medical University of Shandong Province, China
- No. 2024FYM063/the Science and Technology Development Project of Shandong Second Medical University of Shandong Province, China
- No. 2024FYM063/the Science and Technology Development Project of Shandong Second Medical University of Shandong Province, China
- No. 2024FYM063/the Science and Technology Development Project of Shandong Second Medical University of Shandong Province, China
- No. 2024FYM063/the Science and Technology Development Project of Shandong Second Medical University of Shandong Province, China
LinkOut - more resources
Full Text Sources
Medical
Research Materials
