. 2025 May 6;9(1):128.
doi: 10.1038/s41698-025-00917-6.

A machine learning approach for multimodal data fusion for survival prediction in cancer patients

Affiliations

A machine learning approach for multimodal data fusion for survival prediction in cancer patients

Nikolaos Nikolaou et al. NPJ Precis Oncol. .

Abstract

Technological advancements of the past decade have transformed cancer research, improving patient survival predictions through genotyping and multimodal data analysis. However, there is no comprehensive machine-learning pipeline for comparing methods to enhance these predictions. To address this, a versatile pipeline using The Cancer Genome Atlas (TCGA) data was developed, incorporating various data modalities such as transcripts, proteins, metabolites, and clinical factors. This approach manages challenges like high dimensionality, small sample sizes, and data heterogeneity. By applying different feature extraction and fusion strategies, notably late fusion models, the effectiveness of integrating diverse data types was demonstrated. Late fusion models consistently outperformed single-modality approaches in TCGA lung, breast, and pan-cancer datasets, offering higher accuracy and robustness. This research highlights the potential of comprehensive multimodal data integration in precision oncology to improve survival predictions for cancer patients. The study provides a reusable pipeline for the research community, suggesting future work on larger cohorts.


Conflict of interest statement

Competing interests: All authors are or were employees of AstraZeneca at the time this work was performed and may have stock ownership, options, or interests in the company.

Figures

Fig. 1
Fig. 1. Summary of late, early, and intermediate multimodal data fusion strategies.
a Description of strategies and their advantages, disadvantages, and alternative names used in the literature. b Visual explanation.
Fig. 2
Fig. 2. Overview of the AZ-AI multimodal pipeline.
Shown is a brief outline of the pipeline’s main steps and functionalities. Fig. 1 shows a classification of multimodal fusion strategies. The pipeline allows for any of these, depending on which of its execution steps are run “per modality” or “jointly”.
Fig. 3
Fig. 3. [Right] Table showing the advantage d of multimodal versus best unimodal model in terms of average C-index across all 33 TCGA cancer types.
The table also lists the average C-index of the best unimodal model and the size of the training set per cancer type (entries listed in decreasing order). [Left, top] Multimodal advantage d versus training set size. The two quantities are positively correlated (blue trend line added for emphasis). Advantage d and training set size are also positively correlated. [Left, bottom] Associated histogram of advantage d with density fit shown. Dashed line denotes no advantage (d = 0). Multimodal models dominate the best unimodal ones in 25 of the 33 indications (d > 0).
Fig. 4
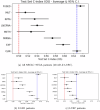
Fig. 4. Performance of multimodal models (FUSED) versus unimodal models of each modality for NSCLC patients.
Results shown for a all NSCLC patients, b LUAD patients only, and c LUSC patients only. The average test set C-index and 95% CI across 10 runs are reported. The red dashed line denotes random prediction performance (C-index = 0.5). The blue dashed line denotes the average C-index of the best individual modality (here: clinical features). Multimodal models outperformed all unimodal models on average and had lower variance. See Supplementary Fig. 1 for other TCGA cancer types.
Fig. 5
Fig. 5. Average test set C-index for each of the 27-1 possible modality combinations for NSCLC patients.
C-index of each modality combination (blue points) on the subset of a all NSCLC TCGA patients (LUAD and LUSC), b LUAD patients only, and c LUSC patients only. The black crosses indicate the average C-index across all multimodal models trained on k modalities, where k is equal to the number shown on the x axes (black trend line added for emphasis). On average, the more modalities added, the better the resulting model. The red dashed lines mark the effect of not including the best individual modality in the multimodal fusion. Also shown is the average test set C-index and 95% CI for: (i) the worst individual modality (orange), (ii) the best individual modality (green), (iii) the best modality combination excluding the clinical features (light blue), (iv) the best modality combination (gold), and (v) the multimodal fusion of all seven modalities (purple). We note the diminishing benefit of adding more modalities and the high “price” of excluding the best individual modality (here: clinical features).
Fig. 6
Fig. 6. Ranking of each modality combination for each TCGA cancer type.
Relative rank (1: best performing to 15: worst performing) attained by each modality combination per cancer type is based on the average C-index of the corresponding survival models across all train/test splits. In case of ties, combinations using fewer modalities are ranked higher, to favor more parsimonious solutions. Rows correspond to modality combinations, columns to cancer types, the last column showing the average rank attained by each modality combination across all cancer types. The modality combinations are ordered according to their average rank (top: best performing, bottom: worst performing).
Fig. 7
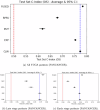
Fig. 7. Performance of multimodal models (FUSED) versus unimodal models of each modality trained on TCGA patients of all cancer types (PANCANCER).
Results shown for patients of a all stages, b late stages (III and V), and c early stages (I, II). Average test set C-index and 95% CIs across 10 runs are reported. The red dashed line denotes random prediction performance (C-index = 0.5). The blue dashed line denotes average C-index of best individual modality (here: clinical features). Multimodal models significantly outperformed all unimodal models and had lower variance.
Fig. 8
Fig. 8. Proposed heterogeneous weighted ensemble-based late fusion strategy.
Schematic description of the strategy, with steps 1–4 detailing the implementation process, as well as the subset of the data used in each step. The equation to obtain the final multimodal (FUSED) prediction using the individual unimodal models is also provided.

References

    1. Picard, M., Scott-Boyer, M. P., Bodein, A., Perin, O. & Droit, A. Integration strategies of multi-omics data for machine learning analysis. Comput. Struct. Biotechnol. J.19, 3735–3746 (2021). - PMC - PubMed
    1. Rappoport, N. & Shamir, R. Multi-omic and multi-view clustering algorithms: review and cancer benchmark. Nucleic Acids Res.46, 10546–10562 (2018). - PMC - PubMed
    1. Stahlschmidt, S. R., Ulfenborg, B. & Synnergren, J. Multimodal deep learning for biomedical data fusion: a review. Brief. Bioinform.23, bbab569 (2022). - PMC - PubMed
    1. Baltrusaitis, T., Ahuja, C. & Morency, L. P. Multimodal machine learning: a survey and taxonomy. IEEE Trans. Pattern Anal. Mach. Intell.41, 423–443 (2019). - PubMed
    1. Huang, Y. et al. In Adv Neural Inf Process Syst. 34 (eds. M. Ranzato et al.) 1–13 (Neural Information Processing Systems Foundation, 2021).

LinkOut - more resources