. 2025 May;57(5):1119-1131.
doi: 10.1038/s41588-025-02173-7. Epub 2025 May 5.

Near-complete Middle Eastern genomes refine autozygosity and enhance disease-causing and population-specific variant discovery

Collaborators, Affiliations

Near-complete Middle Eastern genomes refine autozygosity and enhance disease-causing and population-specific variant discovery

Mohammadmersad Ghorbani et al. Nat Genet. 2025 May.

Abstract

Advances in long-read sequencing have enabled routine complete assembly of human genomes, but much remains to be done to represent broader populations and show impact on disease-gene discovery. Here, we report highly accurate, near-complete and phased genomes from six Middle Eastern (ME) family trios (n = 18) with neurodevelopmental conditions, representing ancestries from Sudan, Jordan, Syria, Qatar and Afghanistan. These genomes revealed 42.2 Mb of new sequence (13.8% impacting known genes), 75 new HLA/KIR alleles and strong signals of inbreeding, with ROH covering up to one-third of chromosomes 6 and 12 in one individual. Using assembly-based variant calling, we identified 23 de novo and recessive variants as strong candidates for causing previously unresolved symptoms in the probands. The ME genomes revealed unique variation relative to existing references, showing enhanced mappability and variant calling. These results underscore the value of de novo assembly for disease variant discovery and the need for sampled ME-specific references to better characterize population-relevant variation.


Conflict of interest statement

Competing interests: E.E.E. is a scientific advisory board member of Variant Bio. The other authors declare no competing interests.

Figures
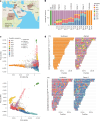
Fig. 1
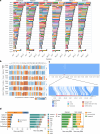
Fig. 1. Genetic ancestry of study samples.
a, Geographic location of the study cohort. b, Global ancestral composition of the individual participants alongside that of CN1, CHM13 and HG002. c, Principal component analysis showing the study samples and reference dataset from QGP and 1KG. d, Local ancestry analysis showing the genetic ancestral makeup of each chromosome for the Sudanese, Afghani, Jordanian and Qatari 2 child participants. The displayed map is from Mapbox and OpenStreetMap, used under the ODbL. ADM, admixed; AFR, Africans; AMR, American; EAS, East Asian; EUR, Europeans; SAS, South Asian; ODbL, Open Database License. Source data
Fig. 2
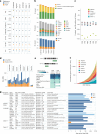
Fig. 2. Assembly, phasing results and QC.
a, QC metrics of each child assembly showing coverage, depth, total contigs, contig N50, maximum contig length and QV. b, Hapmer blob plot of Qatari 2 child sample showing a clear separation of maternal (red) and paternal (blue) haplotypes. Blob size is proportional to contig size, and each blob/contig is plotted according to the count of parental hapmers. c, Phase block NG plots (left) of haplotype-resolved assembly for paternal (top) and maternal (bottom) contigs sorted by size. The x axis represents the percentage of genome size and y axis represents the block size. Incorrectly phased haplotype blocks are virtually absent. Phase block NG and contig NG plots (right) showing the phase block sizes being similar to contig sizes due to low switch error. d, Reliability of the assemblies using read mapping evaluation with Flagger. Source data
Fig. 3
Fig. 3. Contiguity, haplotype alignment to CHM13 and new sequences.
a, Alignment of child assemblies to CHM13 for individual chromosomes. Individual contigs are delineated with distinct colors per chromosomal haplotype. Diamond symbols denote the end points of CHM13 haplotypes. b, Percentage of completeness (y axis) relative to CHM13 per chromosome (x axis), colored by the number of contigs in the alignment. c, Alignment of chromosome 10 of Qatari 2 (top) child assembly to CHM13 (bottom) showing a singular contig spanning the entire chromosome with notable centromeric variation. d, Length of new sequences identified across samples, highlighting location in centromeric regions (left), repetitive regions (middle) and intergenic, intronic/UTR and exonic regions either inside or outside repetitive regions (right). LC, low complexity; LTR, long terminal repeats; SINE, short interspersed nuclear element; Unk, unknown. Source data
Fig. 4
Fig. 4. Gene coverage and HLA and KIR gene annotation.
a, Gene counts across various gene categories. b, Coverage for the largest gene categories. c, New alleles in HLA and KIR genes in the child assembly haplotypes, highlighting the number of mutations in the CDS relative to a reference dataset of 220 pre-annotated reference haplotypes. d, Phylogenetic tree based on neighbor-joining method for the HLA-DQB2 locus showing clustering pattern of the alleles in the child assemblies. New alleles are labeled, showing those with mutations in the CDS region (black squares) and those with mutations in other part of the sequence (gray squares). Next to each leaf-node connecting branch, the corresponding evolutionary distance is marked. Length key is shown in the bottom right. CDS, coding DNA sequence. Source data
Fig. 5
Fig. 5. Genetic variation, ROH and candidate disease-causing variants.
a, SV count against CHM13 and GRCh38 for each child assembly haplotype. b, Count of SV variants (deletions and insertions) in the family trios called against CHM13 and found to be absent from the HPRC dataset, highlighting their spread across intergenic, intronic/UTR and exonic regions (top), repetitive regions (middle) and segmental duplications (bottom). c, Box plot showing median counts of variants per MB relative to African segments in the same participants aggregated per family (n = 15), for various ancestries. d, Cumulative sizes of long and medium ROH of the ME assemblies and the Yoruba 1KG trio. e, Location and count of genes within the long ROH segments for chromosomes 6 and 12 of the Jordanian father. f, Cumulative number of genes (pLI > 0.9) over contigs per child assembly. g, Candidate disease-causing variants in the probands. Shown are the variants, impacted genes, ascertained phenotypes in the child participants and associated details. The comments column indicates whether the variant was identified with read-based calling. Exonic deletions are denoted by an asterisk on the bars. SD, segmental duplication; HPO, Human Phenotype Ontology; Au, autism; CRD, cystic renal dysplasia; DCS, duplicated collecting system; GD, gait disturbance; GI, glaucoma; GDD, global developmental delay; ID, intellectual disability; MRC, multiple renal cysts; S, seizure; T, tall stature; P, pathogenic; LP, likely pathogenic. Source data
Fig. 6
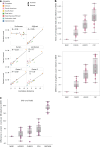
Fig. 6. Variant calling and mappability against MER1 and other references.
a, Euclidean distance versus variant count for each of the child assemblies. Color indicates the ancestry of the test samples. The shape of the markers differentiates the samples with maximum and minimum distance from our assembly for a given ancestry. Regression lines and coefficients of the Pearson correlations are shown. Corresponding P values are <10−4 for all except Sudanese (P = 0.54), calculated using two-sided t test. b, Ratio of unmapped read pairs over mapped and number of singletons relative to MER1 in the replacement chromosomes for ME query samples (n = 15) for various reference genomes. Values were calculated per 1 Mb regions and averaged over chromosomes. c, Differences in variant counts per 1 Mb for ME query samples (n = 15) from various ME ancestries against various reference genomes relative to MER. Source data
Extended Data Fig. 1
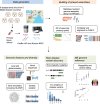
Extended Data Fig. 1. Study overview.
The displayed map is from Mapbox and OpenStreetMap, used under the Open Database License (ODbL).
Extended Data Fig. 2
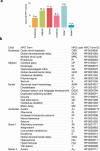
Extended Data Fig. 2. Clinical phenotypes of the children from the family trios in this study.
(a) Age and count of Human Phenotype Ontology (HPO) terms per child. (b) Detailed list of HPO terms and HPO IDs. Source data
Extended Data Fig. 3
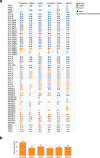
Extended Data Fig. 3. HLA and KIR gene annotations.
a, Known and new alleles in HLA and KIR genes in the child assemblies’ haplotypes, highlighting intact sequences and those having CDS with missing features. b, Count of new alleles with intact CDS regions in each child assembly. Source data
Extended Data Fig. 4
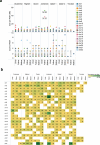
Extended Data Fig. 4. Runs of homozygosity (ROH) per chromosome.
a, Size and count of ROH across chromosomes in all participants compared to YRI trios. b, Heatmap of ROH by chromosome and size, with color intensities reflecting the cumulative ROH size on each chromosome. Source data
Extended Data Fig. 5
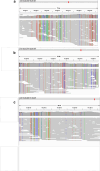
Extended Data Fig. 5. Long ROH in chr6 of the Jordanian father.
ac, IGV visualization of the HiFi read alignments against CHM13 showing the (a) start, (b) middle and (c) the end of the ROH region, revealing uniform homozygous region and introduction of heterozygous sites at the end of ROH.

References

    1. Seo, J. S. et al. De novo assembly and phasing of a Korean human genome. Nature538, 243–247 (2016). - PubMed
    1. Shumate, A. et al. Assembly and annotation of an Ashkenazi human reference genome. Genome Biol.21, 129 (2020). - PMC - PubMed
    1. O’Leary, N. A. et al. Exploring and retrieving sequence and metadata for species across the tree of life with NCBI datasets. Sci. Data11, 732 (2024). - PMC - PubMed
    1. Liao, W.-W. et al. A draft human pangenome reference. Nature617, 312–324 (2023). - PMC - PubMed
    1. Gao, Y. et al. A pangenome reference of 36 Chinese populations. Nature619, 112–121 (2023). - PMC - PubMed

LinkOut - more resources