. 2025 May 5;15(1):15638.
doi: 10.1038/s41598-025-99078-6.

Revisiting the link between COVID-19 incidence and infection fatality rate during the first pandemic wave

Benjamin Glemain  1 Charles Assaad  2 Walid Ghosn  3 Paul Moulaire  2 Xavier de Lamballerie  4 Marie Zins  5   6 Gianluca Severi  7   8 Mathilde Touvier  9 Jean-François Deleuze  10 SAPRIS-SERO study groupNathanaël Lapidus  11 Fabrice Carrat #  11 Pierre-Yves Ancel #  12 Marie-Aline Charles  12 Gianluca Severi  7   8 Mathilde Touvier  9 Marie Zins  5   6 Sofiane Kab  6 Adeline Renuy  6 Stephane Le-Got  6 Celine Ribet  6 Mireille Pellicer  6 Emmanuel Wiernik  6 Marcel Goldberg  6 Fanny Artaud  7 Pascale Gerbouin-Rérolle  7 Mélody Enguix  7 Camille Laplanche  7 Roselyn Gomes-Rima  7 Lyan Hoang  7 Emmanuelle Correia  7 Alpha Amadou Barry  7 Nadège Senina  7 Julien Allegre  9 Fabien Szabo de Edelenyi  9 Nathalie Druesne-Pecollo  9 Younes Esseddik  9 Serge Hercberg  9 Mélanie Deschasaux  9 Marie-Aline Charles  12 Valérie Benhammou  13 Anass Ritmi  14 Laetitia Marchand  14 Cecile Zaros  14 Elodie Lordmi  14 Adriana Candea  14 Sophie de Visme  14 Thierry Simeon  14 Xavier Thierry  14 Bertrand Geay  14 Marie-Noelle Dufourg  14 Karen Milcent  14 Delphine Rahib  15 Nathalie Lydie  15 Clovis Lusivika-Nzinga  11 Gregory Pannetier  11 Nathanael Lapidus  11 Isabelle Goderel  11 Céline Dorival  11 Jérôme Nicol  11 Olivier Robineau  11 Cindy Lai  16 Liza Belhadji  16 Hélène Esperou  16 Sandrine Couffin-Cadiergues  16 Jean-Marie Gagliolo  17 Hélène Blanché  10 Jean-Marc Sébaoun  10 Jean-Christophe Beaudoin  10 Laetitia Gressin  10 Valérie Morel  10 Ouissam Ouili  10 Jean-François Deleuze  10 Laetitia Ninove  4 Stéphane Priet  4 Paola Mariela Saba Villarroel  4 Toscane Fourié  4 Souand Mohamed Ali  4 Abdenour Amroun  4 Morgan Seston  4 Nazli Ayhan  4 Boris Pastorino  4 Xavier de Lamballerie  4
Affiliations

Revisiting the link between COVID-19 incidence and infection fatality rate during the first pandemic wave

Benjamin Glemain et al. Sci Rep. .

Abstract

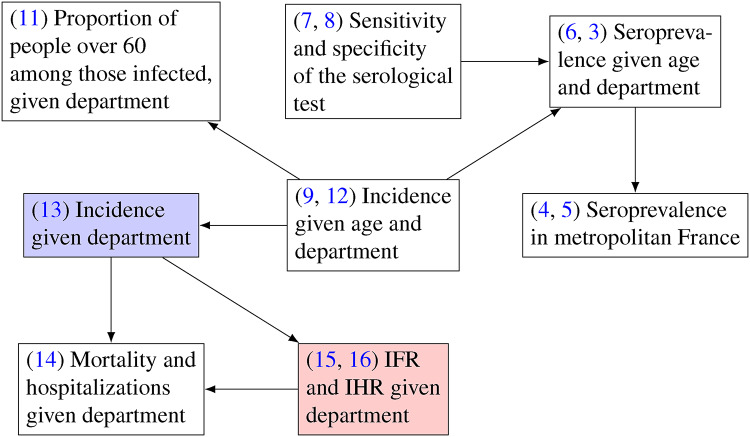
Several studies found an association between COVID-19 incidence, cumulated over the first pandemic wave, and the risk of death for infected individuals. They attributed this association to hospital overload. We studied this association across the French departments using 82,467 serological samples and a hierarchical Bayesian model with spatial smoothing. In high-incidence areas, we hypothesized that hospital overload would increase infection fatality rate (IFR) without increasing infection hospitalization rate (IHR). The analyses were adjusted for intensive care beds per capita, age of the population, and diabetes prevalence (as a surrogate for obesity). We found that increasing departmental incidence from 3 to 9% rose IFR from 0.42 to 1.14% (difference 0.72%, 95% CI 0.49-1.01%), and IHR from 1.66 to 3.61% (difference 1.94%, 95% CI 1.18-2.80%). An increase in incidence from 6 to 12% in people under 60 was associated with an increased proportion of people over 60 among those infected, from 11.6 to 17.4% (difference 5.8%, 95% CI 2.9-8.8%). Higher incidence increased the risk of death for infected individuals and their risk of hospitalization by the same magnitude. These findings could be explained by a higher age among infected individuals in high-incidence areas, rather by than hospital overload.

Keywords: Bayesian statistics; COVID-19; Causal graph; Hierarchical modeling; Hospital overload; Spatial modeling.


Conflict of interest statement

Declarations. Competing interests: The authors declare no competing interests. Ethics approval and consent to participate: Ethical approval and written or electronic informed consent were obtained from each participant before enrollment in the original cohort. The SAPRIS-SERO study was approved by the Sud-Mediterranée III ethics committee (approval 20.04.22.74247) and electronic informed consent was obtained from all participants for dried blood spot testing. The study was registered (#NCT04392388). All methods were performed in accordance with the relevant guidelines and regulations. Consent for publication: Participants can not be identified on the basis of this article.

Figures

Fig. 1
Fig. 1
Causal graph. The variables are considered at the departmental scale. The effect of X on Y can be estimated by adjusting on {Diab., Age, Beds}. X: COVID-19 incidence. Y: IFR (infection fatality rate) or IHR (infection hospitalization rate). Diab.: Prevalence of diabetes. Beds: Number of intensive care beds per inhabitant. Age: Proportion of population over 60. Dashed arrows represent the effects of unmeasured confounders C.
Fig. 2
Fig. 2
Overview of the model. The blue and red rectangles represent the exposure and outcome of the main analysis, respectively. The numbers indicate the equations associated with the variables (see the Model section). IFR: Infection fatality rate. IHR: Infection hospitalization rate.
Fig. 3
Fig. 3
COVID-19 departmental incidence (cumulated over the first wave) in metropolitan France.This map was created using the R package maps: https://cran.r-project.org/web/packages/maps/index.html..
Fig. 4
Fig. 4
Effect of departmental incidence on infection fatality rate (IFR) and on infection hospitalization rate (IHR). The points represent the mean posterior departmental estimates. Black line and gray zone: Posterior mean and 95% CI of the expected adjusted departmental IFR given incidence (or expected causal effect of incidence on IFR: see Eq. 1 of the Methods). The same description applies to IHR. The covariates are represented relative to their medians. Pop. over 60: Proportion of adult population over 60. ICU beds per 1,000 inhab.: Number of intensive care beds per 1,000 inhabitants.
Fig. 5
Fig. 5
Association between incidence in people under 60 and the proportion of people over 60 among those infected. The points represent the mean posterior departmental estimates. Black line and gray zone: Posterior mean and 95% CI of the expected proportion of persons over 60 among those infected (for a department with the same age structure as metropolitan France).

References

    1. Candel, F. J. et al. Temporary hospitals in times of the COVID pandemic. An example and a practical view. Rev. Esp. Quimioter.34, 280. 10.37201/req/041.2021 (2021). - PMC - PubMed
    1. Lefrant, J.-Y. et al. A national healthcare response to intensive care bed requirements during the COVID-19 outbreak in France. Anaesth. Crit. Care Pain Med.39, 709–715. 10.1016/j.accpm.2020.09.007 (2020). - PMC - PubMed
    1. Jimenez, J. V. et al. Outcomes in Temporary ICUs Versus Conventional ICUs: An Observational Cohort of Mechanically Ventilated Patients With COVID-19-Induced Acute Respiratory Distress Syndrome. Crit. Care Explor.4, e0668. 10.1097/CCE.0000000000000668 (2022). - PMC - PubMed
    1. Souris, M. & Gonzalez, J.-P. COVID-19: Spatial analysis of hospital case-fatality rate in France. PLoS One15, e0243606. 10.1371/journal.pone.0243606 (2020). - PMC - PubMed
    1. Zappella, N. et al. Temporary ICUs during the COVID-19 pandemic first wave: Description of the cohort at a French centre. BMC Anesthesiol.22, 310. 10.1186/s12871-022-01845-9 (2022). - PMC - PubMed

LinkOut - more resources