

Transcriptome and metabolome analysis of senescent rice (Oryza sativa L.) seeds: insights into the mechanism of germination vigor and seedling morphogenesis
- PMID: 40325369
- PMCID: PMC12054062
- DOI: 10.1186/s12870-025-06458-1
Transcriptome and metabolome analysis of senescent rice (Oryza sativa L.) seeds: insights into the mechanism of germination vigor and seedling morphogenesis
Abstract
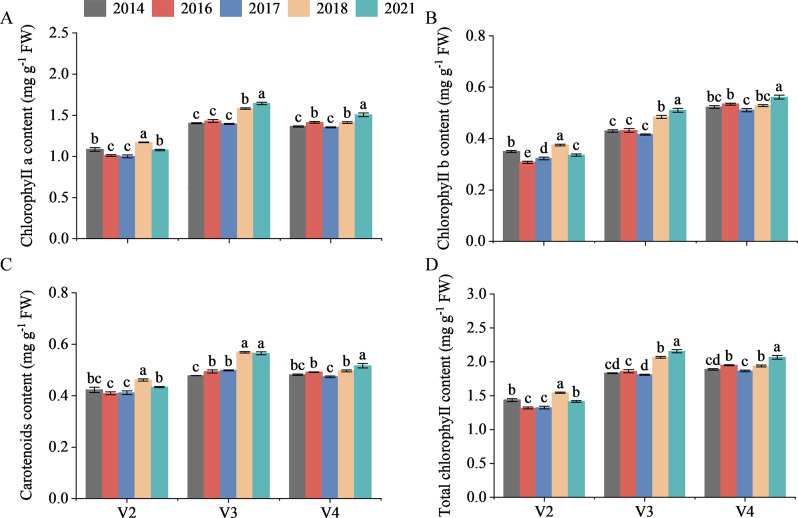
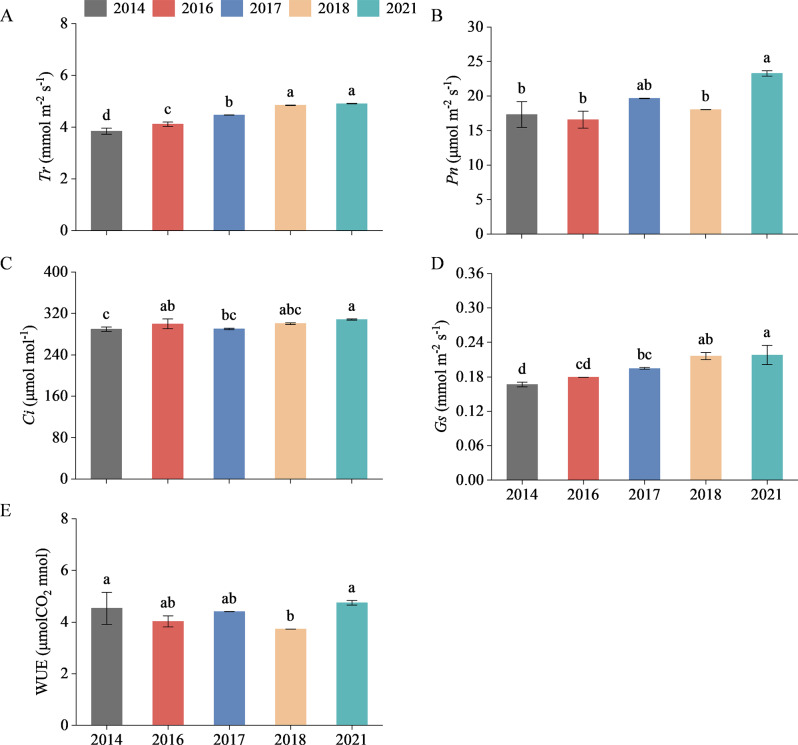
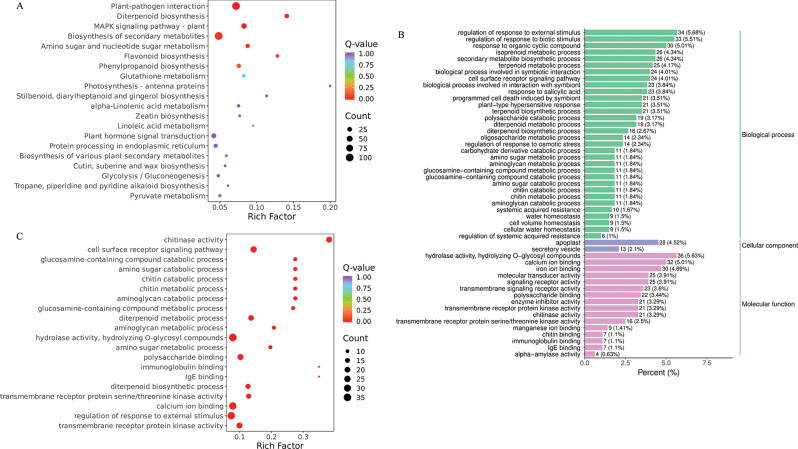
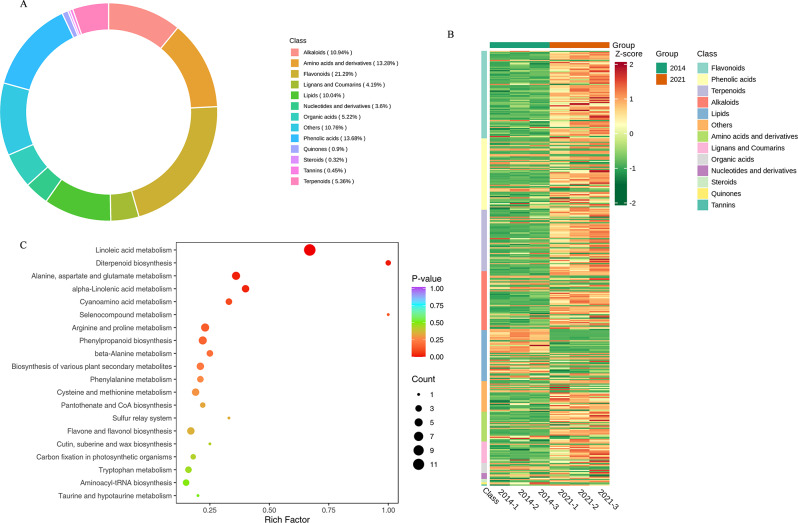
Seeds germination and seedlings growth are crucial factors in ensuring effective rice grain productivity. However, the mechanisms for maintaining seed vigor remains largely unknown. The seed aging phenomenon that occurs during storage poses a significant challenge to crop production, as it can lead to reduced germination rates and impaired seed vitality. The current study explored the underlying mechanisms that enable rice seeds to maintain high germination rates and seedling vigor after long - term storage. We employed transcriptomic and metabolomic techniques to identify metabolic changes and key genes associated with the aging of rice seeds during long - term storage. We utilized indicators such as imbibition rate (IR), germination rate (GR), mean germination time (MGT), germination coefficient (GC), germination index (GI), and germination potential (GP) to comprehensively assess germination activity. Traits including seedling emergence rate, seedling strength index, photosynthetic parameters, carbohydrate accumulation, and enzyme activity related to carbon metabolism were used to determine the impact of seed storage duration on seedling growth. Our research findings revealed significant differences in gene expression patterns and metabolic characteristics among seeds stored for different duration. Notably, IAA levels, the IAA/ABA ratio, and linoleic acid metabolism were identified as key factors affecting germination and seedling development. Results indicated that with the extension of storage duration, the germination potential and seedling development significantly declined. Current study provided a comprehensive understanding of the physiological and molecular mechanisms behind the germination and morphogenesis of rice seeds under different storage years. The insights gained from this study could be utilized to improve the storage and quality control of rice seeds, thereby ultimately enhancing agricultural productivity.
Keywords: Aging rice seeds; Germination vigour; Metabolome analysis; Seedling morphogenesis; Transcriptome.
© 2025. The Author(s).
Conflict of interest statement
Ethics declarations. Ethics approval and consent to participate: Not applicable. Consent for publication: Not applicable. Competing interests: The authors declare no competing interests.
Figures


Similar articles
-
Dynamic transcriptome and metabolome analyses of two types of rice during the seed germination and young seedling growth stages.BMC Genomics. 2020 Aug 31;21(1):603. doi: 10.1186/s12864-020-07024-9. BMC Genomics. 2020. PMID: 32867689 Free PMC article.
-
Integrated metabolomic and transcriptomic strategies to reveal adaptive mechanisms in barley plant during germination stage under waterlogging stress.J Plant Res. 2025 Mar;138(2):289-302. doi: 10.1007/s10265-025-01616-w. Epub 2025 Jan 26. J Plant Res. 2025. PMID: 39864038
-
OsJMJ718, a histone demethylase gene, positively regulates seed germination in rice.Plant J. 2024 Apr;118(1):191-202. doi: 10.1111/tpj.16600. Epub 2023 Dec 20. Plant J. 2024. PMID: 38116956
-
Studies on the molecular mechanisms of seed germination.Proteomics. 2015 May;15(10):1671-9. doi: 10.1002/pmic.201400375. Epub 2015 Mar 16. Proteomics. 2015. PMID: 25597791 Review.
-
Exploring the Role of Carbon Monoxide in Seed Physiology: Implications for Stress Tolerance and Practical Uses.Int J Mol Sci. 2024 Dec 30;26(1):223. doi: 10.3390/ijms26010223. Int J Mol Sci. 2024. PMID: 39796077 Free PMC article. Review.
References
MeSH terms
Grants and funding
- 2021ZDZX4027/Guangdong Provincial Department of Education Key Field Project for Colleges and Universities
- 2024KJ31/Guangdong Provincial Department of Agriculture and Rural Affairs
- 2022XSLT036/Guangdong Provincial Department of Education Graduate Innovation Forum
- 230420020/Supported by Binhai Agricultural Engineering Technology Research Center
- 060302052316/Guangdong Ocean University Research Foundation Project
LinkOut - more resources
Full Text Sources
Miscellaneous
