. 2025 May 5;16(1):227.
doi: 10.1186/s13287-025-04342-1.

Modulation of senescent Lepr+ skeletal stem cells via suppression of leptin-induced STAT3‒FGF7 axis activation alleviates abnormal subchondral bone remodeling and osteoarthritis progression

Affiliations

Modulation of senescent Lepr+ skeletal stem cells via suppression of leptin-induced STAT3‒FGF7 axis activation alleviates abnormal subchondral bone remodeling and osteoarthritis progression

Fu-Hao Yu et al. Stem Cell Res Ther. .

Abstract

Background: Recent studies have suggested that targeting senescent cells in joint tissues may alleviate osteoarthritis (OA) progression. However, this strategy encounters significant challenges, partially due to the high degree of cellular heterogeneity in osteoarthritic tissues. Moreover, little information is available on the role of skeletal stem cell (SSC) senescence, as compared to differentiated cells, in OA progression.

Methods: In this study, single-cell RNA sequencing (scRNA-seq) on articular cartilages and subchondral bones of the knee joints of mice with post-traumatic osteoarthritis (PTOA) were performed. Further in vivo and in vitro studies were performed to reveal the role and mechanisims of senescent SSCs during the development of OA lesions and progression by microCT, pathological analysis, and functional gain and loss experiments. The one-way ANOVA was used in multiple group data analysis.

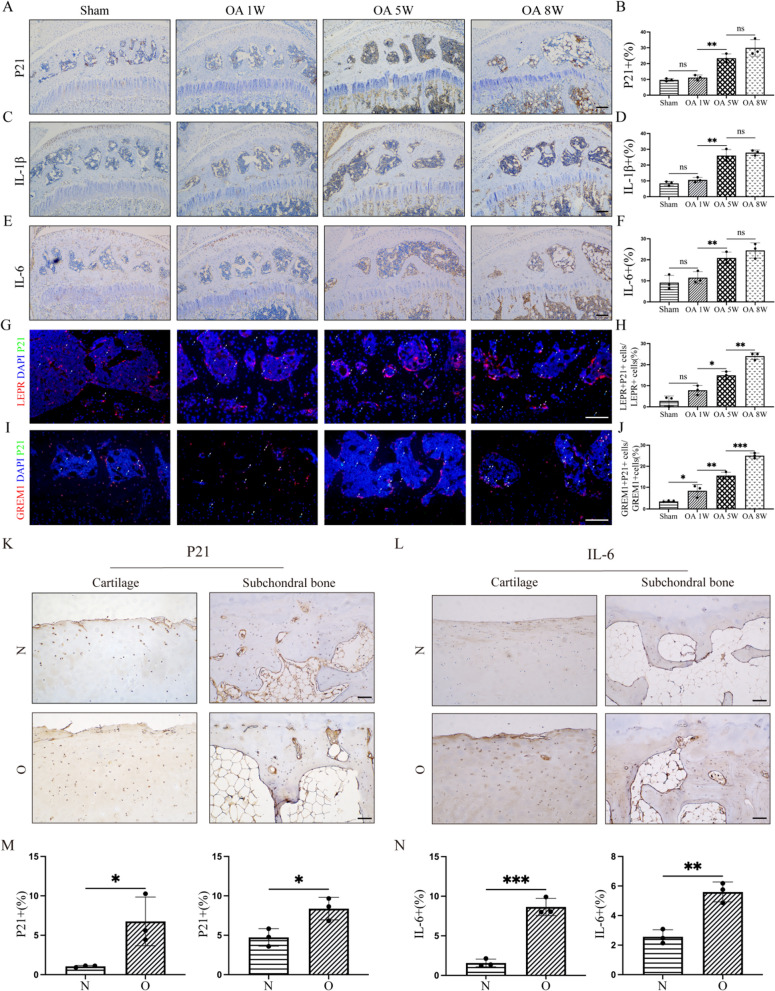
Results: scRNA-seq and pathological data demonstrated that the leptin receptors (Lepr) positive SSCs underwent cellular senescence during OA progression. In addition, the leptin-Lepr signaling pathway induced signal transducer and activator of transcription 3 (STAT3) expression in SSCs, which consequently augmented the transcription of fibroblast growth factor 7 (FGF7). Further scRNA-seq and in vivo analyses revealed that FGF7 exacerbated abnormal bone remodeling in subchondral bones and OA progression by enhancing bone formation and suppressing bone resorption. In vitro analysis revealed that FGF7 induced the osteogenic differentiation of SSCs but inhibited osteoclastogenesis in a concentration-dependent manner.

Conclusions: In summary, our findings demonstrate that the leptin-Lepr signaling pathway promotes SSC senescence and exacerbates subchondral bone remodeling by activating the STAT3-FGF7 axis during OA progression, which may shed light on novel therapeutic strategies for OA.

Keywords: Heterogeneity of Cellular senescence; Leptin-Lepr signaling; Osteoarthritis; STAT3-FGF7 axis; Single-cell sequencing; Skeletal stem cells.


Conflict of interest statement

Declarations. Ethics approval and consent to participate: The animal research involved in this work was approved by the Institutional Animal Care and Use Committee of Military Medical Sciences. Title of the approved project: National Science Foundation for “The regulatory effects of chondrogenic progenitor cells on the osteoclast formation and bone remodeling in osteoarthritis”. The initial Ethics approval (Approval No: IACUC-DWZX-2024-P523) was obtained on February 27, 2024. The care and use of animals were performed strictly following the regulations on the management of experimental animals. The research on human tibia plateau specimens samples involved in this work was approved by the Institutional Review Board at the Chinese People’s Liberation Army General Hospital Title of the approved project: “discarded biological material from knee osteoarthritis patients with total knee arthroplasty for scientific research projects”, The initial Ethics approval (2018-03-15) was obtained on March 15, 2018. Competing interests: The authors declare that they have no competing interests.

Figures

Fig. 1
Fig. 1
Single-cell sequencing revealed that skeletal stem cells underwent cellular senescence in knee osteoarthritis. A Schematic overview of the scRNA-seq workflow. B UMAP plots showing integrated analysis of bone stromal, immune, and synovial cells. The cells are colored according to their clusters. C Proportions of different cell clusters across different sources, including bone stromal cells, bone immune cells, and synovial cells, at different points in the progression of OA. D Stacked bar charts showing the cell cycle status of all samples. E mRNA levels of P21 in all samples. F Scoring of the senescent gene set (SenMayo) in different cell clusters. G, H GO terms enriched in upregulated (G) and downregulated (H) genes
Fig. 2
Fig. 2
Bone stromal cells, particularly SSCs, are significant markers of senescence in osteoarthritis. A, C, E Representative images of P21 (A), IL-1β (C), and IL-6 (E) IHC in articular cartilage and subchondral bone at different points in the progression of OA. Scale bar, 100 μm. B, D, F Quantitative analysis of the P21 (B), IL-1β (D), and IL-6 (F) areas in articular cartilage and subchondral bone (n = 3). G IF staining of Lepr and P21 in mouse subchondral bones in various treatment groups. The white arrows indicate P21-positive cells. Scale bar, 100 μm. H Proportion of Lepr+P21+ cells among Lepr+ cells (n = 3). I IF staining of Grem1 and P21 in the subchondral bones of mice in various treatment groups. The white arrows indicate the double-positive cells. Scale bar, 100 μm. J Proportion of Grem1+P21+ cells among Grem1+ cells (n = 3). K, L Representative images of P21 (K) and IL-6 (L) IHC in the articular cartilage and subchondral bone of OA human samples. The N side represents the less severely diseased side of the source joint, whereas the O side represented the more severely diseased side of the joint. Scale bar, 100 μm. M, N Quantitative analysis of P21 (M) and IL-6 (N) levels in articular cartilage and subchondral bone (n = 3). Quantitative analyses were conducted using the IHC Profiler plug-in for Image J. All data are presented as the mean ± S.D. *P < 0.05; **P < 0.01; ***P < 0.001; ns, not significant
Fig. 3
Fig. 3
Inhibition of the leptin-Lepr signaling pathway mitigated SSC senescence and OA progression. A GO enrichment of pathways associated with significantly upregulated genes (p.adjust < 0.05) in the normal versus OA 8W groups. B GSEA enrichment of pathways associated with significantly upregulated genes (p.adjust < 0.05) in the normal versus OA 8W groups. C, D mRNA levels of leptin in osteochondral tissues from human (C) and OA mice (D) samples. The N side represents the less severely diseased side of the source joint, whereas the O side represents the more severely diseased side of the joint. E Schematic of the experimental design. The mice were subjected to ACLT surgery and received intra-articular treatment (n = 3). F, G Representative images of safranin O/Fast Green staining and OARSI grades of the mice that received different treatments at 8 weeks after ALCT surgery. Scale bars, 100 μm. H Representative images of COL II IHC in the articular cartilage and subchondral bone of mice that received different treatments at 8 weeks after ALCT surgery. Scale bar, 100 μm. I Quantitative analysis of the COL II area in articular cartilage and subchondral bone. J IF staining of Grem1 and P21 in the subchondral bones of mice that received different treatments at 8 weeks after ALCT surgery. The white arrows indicate P21-positive cells. Scale bar, 100 μm. K Proportion of Grem1+P21+ cells among Grem1+ cells. L Micro-CT scans of knee joints from various treatment groups after ALCT surgery. M, N Microarchitectures of tibial subchondral bones showing BV/TV (M) and SBP.th (N). Quantitative analyses were conducted using the IHC Profiler plug-in for ImageJ. All data are presented as the mean ± S.D. *P < 0.05; **P < 0.01; ***P < 0.001; ns, not significant
Fig. 4
Fig. 4
The expression of STAT3 and FGF7 in SSCs increased during OA progression. A Schematic of the protein interaction diagram related to Lepr. B mRNA levels of STAT3 in SSCs at different time points after ALCT. C, D QPCR analysis of the expression levels of STAT3 in OA mouse (C) and human (D) samples. The N side represents the less severely diseased side of the s source joint, whereas the O side represents the more severely diseased side of the joint. E CellChat analysis was performed to investigate the cell‒cell communication patterns between clusters in articular cartilage. The overall outgoing and incoming signal strengths of each cluster were visualized in a scatter plot. F The relative strength of all enriched signals (outgoing and incoming) across various clusters was visualized in a heatmap. G Violin plot showing the expression of canonical markers in the FGF signal. H FGF signaling pathway-associated ligand‒receptor. I Circle plots showing the dynamic alterations in the interaction networks between Fgf7 and Fgfr1 as well as between Fgf7 and Fgfr2. J, L Representative images of FGF7 IHC in articular cartilage and subchondral bone in OA mouse (J) (n = 3) and human (L) (n = 2) samples. Scale bar, 100 μm. K, M Quantitative analysis of the FGF7 area in articular cartilage and subchondral bone in OA mouse (K) and human (M) samples. N, O QPCR analysis of the expression levels of FGF7 in OA mouse (N) and human (O) samples. Quantitative analyses were conducted using the IHC Profiler plug-in for ImageJ. All data are presented as the mean ± S.D. *P < 0.05; **P < 0.01; ***P < 0.001; ns, not significant
Fig. 5
Fig. 5
The leptin-Lepr signaling pathway enhances expression of FGF7 via STAT3 activation. A Western blot analysis of the levels of STAT3 and FGF7 in MG63, hFOB, and OPC cells following leptin treatment. B Western blot analysis of STAT3 and FGF7 in MG63, hFOB, and OPC cells following treatment with leptin and Stattic. C The STAT3 binding site was predicted in the region of the FGF7 promoter by JASPAR. D ChIP-seq peaks used to identify motifs. E Luciferase assay group information. F Schematic of the luciferase assay regimen. G Luciferase activity in different groups. All data are presented as the mean ± S.D. *P < 0.05; **P < 0.01; ***P < 0.001; ns, not significant
Fig. 6
Fig. 6
FGF7 regulated bone remodeling during OA progression. A, B Schematic of the treatment regimen (n = 3). C Knee articular cartilage safranin O/Fast Green staining in various treatment groups. Scale bar, 100 μm. D Representative images of COL II IHC in the articular cartilage and subchondral bone of various treatment groups. Scale bar, 100 μm. E Representative fluorescence images of Sp7-Cre/ERT2-Td knee joints with DAPI staining. F TRAP staining image of tibial subchondral bone and trabecular bone. Scale bar, 100 μm. G OARSI grade of the knee articular cartilage. H Quantitative analysis of the COL II area in articular cartilage and subchondral bone. I, J qPCR analysis of the expression levels of FGF7, RUNX2, SP7, Cx43, COL1a1, and SPP1 in various treatment groups. K Micro-CT scans of knee joints from various treatment groups after ALCT surgery. L, M Microarchitectures of tibial subchondral bones showing BV/TV (L) and Tb.Sp (M). Quantitative analyses were conducted using the IHC Profiler plug-in for ImageJ. All data are presented as the mean ± S.D. *P < 0.05; **P < 0.01; ***P < 0.001; ns, not significant

References

    1. Frydendal T, Christensen R, Mechlenburg I, Mikkelsen LR, Varnum C, Graversen AE, Kjaersgaard-Andersen P, Revald PH, Hofbauer C, Bieder MJ, et al. Total hip replacement or resistance training for severe hip osteoarthritis. N Engl J Med. 2024;391:1610–20. 10.1056/NEJMoa2400141. - PubMed
    1. Sharma L. Osteoarthritis of the knee. N Engl J Med. 2021;384:51–9. 10.1056/NEJMcp1903768. - PubMed
    1. Hunter DJ, Bierma-Zeinstra S. Osteoarthritis. Lancet. 2019;393:1745–59. 10.1016/S0140-6736(19)30417-9. - PubMed
    1. Jing Y, Jiang X, Ji Q, Wu Z, Wang W, Liu Z, Guillen-Garcia P, Esteban CR, Reddy P, Horvath S, et al. Genome-wide CRISPR activation screening in senescent cells reveals SOX5 as a driver and therapeutic target of rejuvenation. Cell Stem Cell. 2023;30(1452–1471): e1410. 10.1016/j.stem.2023.09.007. - PubMed
    1. Childs BG, Gluscevic M, Baker DJ, Laberge RM, Marquess D, Dananberg J, van Deursen JM. Senescent cells: an emerging target for diseases of ageing. Nat Rev Drug Discov. 2017;16:718–35. 10.1038/nrd.2017.116. - PMC - PubMed

MeSH terms

LinkOut - more resources