. 2025 May;14(9):e70860.
doi: 10.1002/cam4.70860.

Hypoxia and Hypoxia-Reoxygenation Potentiate Helicobacter pylori Infection and Gastric Epithelial Cell Proliferation

Affiliations

Hypoxia and Hypoxia-Reoxygenation Potentiate Helicobacter pylori Infection and Gastric Epithelial Cell Proliferation

Indrajit Poirah et al. Cancer Med. 2025 May.

Abstract

Introduction: The gastric epithelium experiences intermittent hypoxia due to various physiological and pathological conditions. However, the impact of hypoxia and hypoxia-reoxygenation of gastric epithelial cells (GECs) on Helicobacter pylori-mediated gastric cancer (GC) has never been investigated. Carcinoembryonic antigen-related cell adhesion molecules (CEACAMs) facilitate H. pylori adhesion onto GECs. We evaluated the effect of hypoxia and hypoxia-reoxygenation on CEACAM6-mediated H. pylori binding, infection, reactive oxygen species (ROS) generation, and GEC proliferation.

Methods: Hypoxia-inducible factor 1 (HIF1α) and CEACAM6 levels were assessed in various GECs. ROS were measured using 2',7'-dichlorofluorescin diacetate (DCFDA). Bioinformatics analyses were performed to identify the most prominent stomach adenocarcinoma (STAD)-associated NADPH oxidase (NOX) followed by validation by overexpression/suppression studies and western blotting. GC biopsies were examined by immunofluorescence microscopy. Hypoxia-exposed, reoxygenated, or control cells were compared for ROS generation and H. pylori infection. MTT assay determined cell proliferation.

Results and conclusions: Hypoxia and HIF1 mediated upregulation of CEACAM6 in GECs. CEACAM6 significantly promoted ROS generation by inducing NOX4 in hypoxic GECs. HIF1α, CEACAM6, and NOX4 upregulation was detected in gastritis and GC tissues. H. pylori infection significantly increased in hypoxia-exposed GECs as compared to normoxic GECs. Infection of hypoxia-reoxygenated GECs also resulted in significantly increased CEACAM6 and NOX4-mediated ROS generation compared to normoxic GECs. In addition, adhesion of H. pylori, cytotoxin-associated gene A (CagA) translocation, and GEC proliferation were significantly enhanced in hypoxia-reoxygenated GECs. Collectively, this study established that hypoxia and hypoxia-reoxygenation of GECs facilitate H. pylori infection and infection-mediated GEC proliferation.

Keywords: Helicobacter pylori, hypoxia; NADPH oxidase 4; carcinoembryonic antigen; hypoxia‐inducible factor 1; hypoxia‐reoxygenation; reactive oxygen species.


Conflict of interest statement

The authors declare no conflicts of interest.

Figures
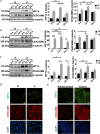
FIGURE 1
FIGURE 1
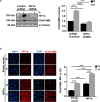
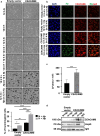
Hypoxia induces CEACAM6. Western blotting of whole cell lysates of AGS (a), MKN45 (b), and HFE145 (c) cells kept at normoxia or hypoxia (=H, 3% O2) showing levels of HIF1α and CEACAM6 at 6, 12, and 24 h. α‐tubulin was used as loading control. Bar graphs indicated a significant increase in CEACAM6 level at 12‐h time point. (d) A representative (n = 3) immunofluorescence micrograph showing elevated levels of HIF1α (green) and CEACAM6 (red) in AGS cells at 12 h of hypoxia (3% O2) exposure. Objective used = 40×, scale bar = 50 μm. (e) A representative (n = 3) immunofluorescence micrograph of human metastatic GC biopsy tissue sample showing the status of HIF1α (red) and CEACAM6 (green). Nuclei were stained for DAPI (blue). Tissues were sectioned at 5 μm thickness. Images were captured using 20× objective and scale bars = 50 μm. Graphs = mean ± SEM. Statistical significance was determined using two‐way ANOVA followed by Tukey's post hoc analysis (n = 3). *p < 0.05; **p < 0.01; ***p  < 0.001; ****p < 0.0001.
FIGURE 2
FIGURE 2
HIF1α upregulates CEACAM6 in hypoxic GECs. (a) Knockdown of HIF1α decreased hypoxia‐induced CEACAM6 protein level in AGS cells as detected by western blot. Whole cell lysates of HIF1α shRNA expressing as well as control shRNA‐expressing stable AGS cells, kept under normoxic and hypoxic conditions for 12 h, showed decreased levels of HIF1α as well as CEACAM6. Bar graphs showed a significant reduction in CEACAM6:α‐tubulin ratio in normoxia as well as hypoxia. (b) Representative micrographs showing CEACAM6 upregulation in HIF1α stably expressing AGS cells at 12 h hypoxia. The nuclei were stained with DAPI. Scale bar = 20 μm, =60×. Bar graph indicated significant changes in the mean fluorescence intensity. Hypoxia = 3% O2. All graphical data indicated mean ± SEM. Two‐way ANOVA was applied to determine statistical significance, and the results were corrected for multiple comparisons using Tukey's post hoc analysis. n = 3, *p < 0.05; ****p < 0.0001.
FIGURE 3
FIGURE 3
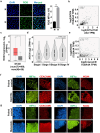
Hypoxia and HIF1α upregulate CEACAM6 and NOX4 in hypoxic GECs, gastritis as well as GC samples. (a) Immunofluorescence microscopy images showing enhanced ROS production in AGS cells under hypoxia. The mean fluorescence intensity (MFI) graph denoted the significant difference in ROS generation between normoxia and hypoxia. Graphical data indicated mean ± SEM. Paired t‐test was performed to determine statistical significance. n = 3, **p < 0.01. (b) Correlation analysis performed in GEPIA2 showed a positive Pearson correlation coefficient between HIF1α and NOX4 gene expression normalized to TUBA4A (p = 0, R = 0.64). (c) Box plot representation of NOX4 expression in STAD tumor and normal samples (red = tumor, gray = normal) showed a significant NOX4 upregulation in tumor samples (num[T] = 408, num[N] = 36, p value cutoff was 0.01). (d) Pathological stage plot showed a high association of NOX4 with the four stages of STAD tumor (F value = 5.67, Pr(>F) = 0.000832). (e) GEPIA2 correlation analysis showed a positive Pearson correlation coefficient between CEACAM6 and NOX4 (p = 7.3e‐05, R = 0.19). (f) Immunofluorescence micrographs of human gastritis biopsy tissue sample showing the status of HIF1α (green), CEACAM6 (red), and NOX4 (red) (n = 3). (g) Human metastatic GC biopsy tissue and their paired normal tissues (n = 3) showing enhanced expression of HIF1α (green), CEACAM6 (red), and NOX4 (red) in GC samples. Nuclei were stained for DAPI (blue). Graphical representation showing significant changes in the levels of HIF1α, CEACAM6, and NOX4 are present in Figure S3. Tissues were sectioned at 5 μm thickness. Images were captured using 20× objective and scale bars = 50 μm. In panel c, *indicates significance.
FIGURE 4
FIGURE 4
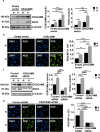
CEACAM6 upregulates NOX4 and increases ROS production in hypoxic AGS cells. (a) A representative western blot showing significant upregulation of NOX4 in CEACAM6 stably expressing hypoxic AGS cells. (b) Immunofluorescence microscopy data showed elevated ROS production in CEACAM6‐stably expressing AGS cells in hypoxia. Bar graphs of MFI indicated a significant elevation of hypoxia‐mediated ROS generation in CEACAM6‐overexpressed stable AGS cells. (c) Hypoxia‐exposed, CEACAM6 siRNA transiently transfected AGS cells analyzed by western blotting showed significant suppression of NOX4 protein levels. (d) Representative immunofluorescence microscopy performed on control and CEACAM6 siRNA transiently transfected normoxic and hypoxic AGS cells and the MFI graph confirmed a significant reduction of hypoxia‐mediated ROS generation with the suppression of CEACAM6. In both b and d, nuclei were stained with DAPI. n = 3, Objective used 60×, scale bars represented 25 μm. All graphical data represented mean ± SEM. Two‐way ANOVA was performed and the results were corrected for multiple comparisons using Tukey's post hoc analysis. n = 3, *p < 0.05; **p < 0.01; ***p < 0.001; ****p < 0.0001.
FIGURE 5
FIGURE 5
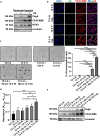
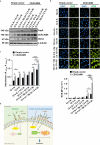
Hypoxia and hypoxia‐reoxygenation of GECs promote H. pylori infection. (a) CagA translocation, CEACAM6 and NOX4 protein levels in AGS cells increased in the presence of hypoxia and H. pylori (mentioned as Hp in the Figure) (graphical data can be found in Figure S6a–c). (b) Confocal imaging data revealed that H. pylori infection of AGS cells was increased in the presence of hypoxia. H. pylori  = green, CEACAM6 = red. Nuclei were stained for DAPI. Objective used 63×, scale bar = 20 μm. (c) AGS cells were either kept in hypoxia or normoxia for 12 h followed by H. pylori (50 MOI) infection for 12 h or cells were left uninfected in normoxic condition. Bright field imaging (n = 3) revealed that hypoxia‐reoxygenated infected cells showed significantly increased hummingbird formation. Objective used 40×, scale bar = 25 μm. (d) Graphical representation of changes in proliferation of the same experimental sets of cells as mentioned in panel c and assessed by the MTT assay. The result showed significantly enhanced proliferation in hypoxia‐reoxygenated H. pyloriinfected cells as compared to the normoxia‐exposed infected cells. (e) A representative western blot (n = 3) of whole cell lysates from the same experimental sets showed a significant increase (graphical data shown in Figure S6d,e) in CagA translocation as well as CEACAM6 level in hypoxia‐reoxygenated infected cells as compared to the cells kept in normoxia before the infection. For all graphs = mean ± SEM. One‐way ANOVA was performed to assess the statistical significance between the different groups, n = 3, *p < 0.05; **p < 0.01; ***p < 0.001; ****p < 0.0001. In the Figure, Hp = H. pylori .
FIGURE 6
FIGURE 6
Helicobacter pylori infection is promoted in hypoxia‐reoxygenated CEACAM6‐expressing GECs. (a) Bright field micrographs and bar graph (n = 4) showing a significant increase in H. pylori ‐induced hummingbird formation in hypoxia‐reoxygenated and CEACAM6 stably‐expressing AGS cells. Two‐way ANOVA was performed to assess the statistical significance between groups. Objective used 20X, scale bars representing 100 μm. (b) Confocal microscopy revealed that H. pylori adhesion to CEACAM6 stably‐expressing hypoxia‐reoxygenated cells was noticeably more as compared to the empty vector‐expressing hypoxic cells. H. pylori  = green, CEACAM6 = red. Nuclei were stained for DAPI. Objective used 63×, scale bars representing 20 μm. (c) Viable H. pylori count was significantly higher in CEACAM6 overexpressed hypoxia and reoxygenation‐treated H. pyloriinfected cells compared to the empty vector‐expressing group. (d) Molecular complexes were prepared by coincubating bacterial outer membrane lysates and cell lysates from normoxic or hypoxic CEACAM6 or empty vector‐expressing stable cells. These complexes were immunoprecipitated using CEACAM6 antibody and western blotted for HopQ and CEACAM6. IgG band ensured equal loading. For all graphs = mean ± SEM. Paired t test was performed to assess the statistical significance between the two groups, n = 3, *p < 0.05; **p < 0.01; ***p < 0.001; ****p < 0.0001. In the Figure, Hp = H. pylori .
FIGURE 7
FIGURE 7
CEACAM6‐expressing GECs activate the CEACAM6‐NOX4 cascade, upregulate ROS generation, and gain significantly more proliferative ability after being exposed to hypoxia‐reoxygenation and H. pylori infection. (a) Western blot analysis showed that levels of CagA, CEACAM6, and NOX4 were significantly increased (graphical representations are shown in Figure S7a–c) in AGS cells upon CEACAM6 stable overexpression and hypoxia‐reoxygenation before infection with H. pylori . (b) Fluorescence micrographs and graphical data (n = 3) demonstrated enhanced ROS production in hypoxia and reoxygenation‐exposed and H. pylori ‐infected CEACAM6 overexpressing AGS cells when compared with the empty vector‐expressing stable cells with similar treatments. For ROS detection, cells were incubated with 1 μM DCFDA for 1 h after infection. Nuclei were stained with DAPI. (c) Graphical representation of cellular proliferation assessed by MTT assay (n = 3) showed significantly increased proliferation of H. pylori ‐infected cells with CEACAM6 overexpression as well as hypoxia‐reoxygenation when compared with the empty vector‐expressing as well as normoxia‐exposed cells. Objective used—60×, scale bars representing 25 μm. Graphs = mean ± SEM. Statistical significance was determined using two‐way ANOVA followed by Tukey's post hoc analysis (n = 3). *p < 0.05; **p < 0.01; ***p < 0.001; ****p < 0.0001. In the Figure, Hp = H. pylori . (d) The summary figure depicting the regulation of ROS signaling events in H. pyloriinfected normoxic and hypoxic GECs. H. pylori infection of GECs leads to the accumulation of HIF1α in normoxia, but the effect is far more enhanced in hypoxic cells due to the increased level of HIF1 and HIF1‐driven CEACAM6 upregulation. CEACAM6 facilitates H. pylori adhesion and upregulates ROS via enhanced NOX4 generation. Enhanced HIF1‐CEACAM6‐NOX4 signaling has a proliferative effect on GECs. Numbers indicate the sequence of events.

References

    1. Tarnawski A. S., Ahluwalia A., and Jones M. K., “Increased Susceptibility of Aging Gastric Mucosa to Injury: The Mechanisms and Clinical Implications,” World Journal of Gastroenterology 20 (2014): 4467–4482. - PMC - PubMed
    1. Franco A. T., Johnston E., Krishna U., et al., “Regulation of Gastric Carcinogenesis by Helicobacter pylori Virulence Factors,” Cancer Research 68, no. 2 (2008): 379–387, 10.1158/0008-5472.CAN-07-0824. - DOI - PMC - PubMed
    1. Pawar A., Sinha V., Sharma P., and Sinha D. K., “High Altitude Area – A Risk Factor for Gastric Perforation?: A Case Series,” International Journal of Surgery Case Reports 53 (2018): 429–432. - PMC - PubMed
    1. Sharma P. K., Suri T. M., Venigalla P. M., et al., “Atrophic Gastritis With High Prevalence of Helicobacter pylori Is a Predominant Feature in Patients With Dyspepsia in a High Altitude Area,” Tropical Gastroenterology 35 (2014): 246–251. - PubMed
    1. Barrera E. C., Martinez E. Z., Brunaldi M. O., et al., “Influence of High Altitude on the Expression of HIF‐1 and on the Prognosis of Ecuadorian Patients With Gastric Adenocarcinoma,” Oncotarget 13 (2022): 1043–1053. - PMC - PubMed

MeSH terms