. 2025 May;14(5):e70083.
doi: 10.1002/jev2.70083.

Cancer-Specific RNA Modifications in Tumour-Derived Extracellular Vesicles Promote Tumour Growth

Affiliations

Cancer-Specific RNA Modifications in Tumour-Derived Extracellular Vesicles Promote Tumour Growth

Yuya Monoe et al. J Extracell Vesicles. 2025 May.

Abstract

RNA modifications are crucial in cellular processes, and their dysregulation is linked to diseases like cancer. Extracellular vesicles (EVs) contain various RNAs and might be susceptible to modifications, but detecting these modifications has been challenging due to the small amount of RNA in EVs. We successfully detected 22 RNA modifications in EVs using a proprietary ultra-HPLC MS/MS system. We identified reduced levels of N6-methyladenosine (m6A) in EVs derived from colon cancer tissues, which correlated with cancer recurrence. Increasing m6A levels via m6A demethylase Alkbh5 knockout suppressed the tumour-promoting effects of colorectal cancer EVs. Mechanistically, colorectal cancer-derived EVs increased tumour necrotic factor α and interleukin-6 secretion by macrophages via Toll-like receptor 8 in an m6A-dependent manner, promoting cancer cell proliferation. RNA-sequencing analysis showed that the levels of 5'-half-tRNA fragment (5'-half)-GlyGCC as well as those of m6A-modified 5'-half-GlyGCC were higher and lower, respectively, in colorectal cancer EVs than in normal colon tissue EVs. Cancer-derived EVs containing 5'-half-GlyGCC significantly promoted tumour growth, which was impeded by macrophage depletion. These findings provide evidence that cancer-specific RNA modifications are present in EVs, promoting tumour progression by regulating immune cells.

Keywords: 5′‐half‐GlyGCC; RNA modification; colorectal cancer; extracellular vesicles; inflammatory cytokines.


Conflict of interest statement

The authors declare no conflicts of interest.

Figures
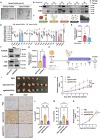
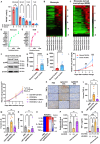
FIGURE 1
FIGURE 1
m6A levels in colorectal cancer Te‐EVs regulate tumour progression. (A) Representative images of non‐cancerous colon Te‐EVs (Normal Te‐EVs) and colorectal cancer Te‐EVs (Tumour Te‐EVs). Black bars indicate 200 nm. (B) Western blot analysis of Te‐EVs (Patient No. 37, 41, 54, 56, 58, 65) using an anti‐CD9 and CD63 antibody. (C) Experimental scheme for Te‐EV isolation and subsequent RNA modification analysis. (D) UHPLC‐MS/MS results for normal small Te‐EVs (n = 42) and tumour small Te‐EVs (n = 42). Wilcoxon signed‐rank test; **p < 0.01, ***p < 0.001, ****p < 0.0001. (E) m6A levels in tumour Te‐EVs from patients with ((+); n = 11) or without ((–); n = 27) recurrence. Values are presented as the mean ± SEM for each group. Mann–Whitney test; *p < 0.05. (F) Whole‐cell lysates and small EVs obtained from control colon26 cells (sgControl) or Alkbh5 knockout colon26 cells (sgAlkbh5) were subjected to Western blot analysis using anti‐Alkbh5, anti‐β‐actin, anti‐CD9, and anti‐CD63 antibodies. Representative images from three independent experiments are shown. (G) UHPLC‐MS/MS results for sgControl and sgAlkbh5 EVs. Values are presented as the mean ± SEM for each group. Unpaired t‐test; *p < 0.05. (H) Experimental scheme for colon26 inoculation and subsequent EV injection. Colon26 cells were injected into BALB/c mice. PBS, sgControl EVs, or sgAlkbh5 EVs were injected i.p., and the tumour size was measured and calculated every day. (I) Representative allograft tumour images. White scale bar, 1 cm. (J) Relative tumour volume. Values are presented as the mean ± SEM for each group. One‐way ANOVA post‐hoc Tukey's test; *p < 0.05, **p < 0.01, ns: not significant. (K) Ki67 and CD31 expression in mouse tumours were examined using immunohistochemical staining. Black bars indicate 100 µm. Representative images of three samples are presented. H‐score for Ki67(L), CD31(M) expression. Values are presented as the mean ± SEM for each group. One‐way ANOVA with Tukey's post hoc test; **p < 0.01, ns: not significant. (N) Colon26 cells were treated with PBS, sgControl EVs, or sgAlkbh5 EVs. Values are presented as the mean ± SEM for each group. One‐way ANOVA with Tukey's post hoc test; ns, not significant. See also Figures S1 and S2.
FIGURE 2
FIGURE 2
Colorectal cancer‐small Te‐EVs promote inflammation in macrophages and cancer cell proliferation. (A) Normal colon small EVs (N) and colon cancer tissue small EVs (T) were labelled with PKH26 and added to PBMCs. The percentage of PKH26‐positive EVs in each PBMC sample was measured using flow cytometry. Values are presented as the mean ± SEM for each group. Wilcoxon signed‐rank test; ns, not significant. (B) Heatmap of the cytokine array performed using conditioned medium from monocytes (B) or monocyte‐derived macrophages (MDM, C) treated with normal (n = 4) or tumour (n = 4) small Te‐EVs. Enrichment analysis of the cytokine array using conditioned medium from monocytes (D) or MDM (E) treated with normal (n = 4) or tumour (n = 4) small Te‐EVs. (F) Whole‐cell lysates obtained from normal or tumour small Te‐EV‐treated MDM were subjected to Western blot analysis using anti‐phospho p65 antibody, anti‐p65 antibody and anti‐β‐actin antibody. Representative images of three independent experiments are shown. ELISA was conducted using conditioned medium from MDM treated with normal (n = 18) or tumour (n = 18) small Te‐EVs. TNF‐α (G) and IL‐6 (H) levels. Values are presented as the mean ± SEM for each group. Wilcoxon signed‐rank test; ****p < 0.0001. (I) HT29 cells were cultured in a conditioned medium from MDM treated with normal (n = 18) or tumour (n = 18) small Te‐EVs. Values are presented as the mean ± SEM for each group. Wilcoxon signed‐rank test: **p < 0.01, ***p < 0.001. (J) HT29 cells were cultured in a conditioned medium with differentiated THP‐1 (dTHP‐1) cells treated with CCD‐841‐CoN small EVs or HT29 small EVs alone or in combination with TNF‐α or IL6 antibodies. Values are presented as the mean ± SEM for each group. One‐way ANOVA post hoc Tukey's test; *p < 0.05, **p < 0.01, ***p < 0.001. (K) Immunohistochemical analysis of TNF‐α, IL‐6 and F4/80 expression in the tumour tissues of mice inoculated with small EVs obtained from Alkbh5 knockout (sgAlkbh5 EVs) or control colon26 cells (sgControl EVs). Scale bar: 100 µm. Representative images of five (PBS group) and seven (sgControl EVs and sgAlkbh5 group) independent experiments are shown. H‐scores of TNF‐α (L), IL‐6 (M) and F4/80 (N) expression. Values are presented as the mean ± SEM for each group. One‐way ANOVA post hoc Tukey's test; *p < 0.05. ns, not significant. (O) Heatmap of cytokine array using conditioned medium from RAW264.7 cells treated with sgControl EVs (n = 4) or sgAlkbh5 EVs (n = 4). (P) HT29‐derived EV‐RNA was reacted with recombinant ALKBH5 (rALKBH5), and m6A levels were measured. Heat‐denatured rALKBH5 served as a negative control. Values are presented as the mean ± SEM for each group. One‐way ANOVA post hoc Tukey's test; *p < 0.05, ns, not significant. (Q) HT29‐derived EV‐RNA was pretreated with or without rALKBH5 and introduced into dTHP‐1 cells. TNF‐α concentration was then measured via ELISA using conditioned medium from dTHP‐1 cells. Heat‐denatured rALKBH5 served as a negative control. Values are presented as the mean ± SEM for each group. One‐way ANOVA post hoc Tukey's test; *p < 0.05, **p < 0.01, ***p < 0.001. ns, not significant. See also Figures S3–S6.
FIGURE 3
FIGURE 3
Association of m6A levels in tumour Te‐EVs with inflammatory status of clinical tumour tissues. Correlation analysis of m6A levels in tumour small Te‐EVs and the amount of TNF‐α (A) or IL‐6 (B) released from tumour small Te‐EV‐treated monocyte‐derived macrophages (MDMs). Spearman's correlation coefficient r was calculated. Correlation analysis of m6A levels in tumour large Te‐EVs and the amount of TNF‐α (C) or IL‐6 (D) released from tumour large Te‐EV‐treated MDMs. Spearman's correlation coefficient r was calculated. (E) Immunohistochemical analysis of TNF‐α, IL‐6 and CD68 expression in colorectal cancer clinical tissue with or without recurrence. Representative images are shown (21 tumour tissues obtained from recurrence‐free patients and eight tumour tissues from relapsed patients). The scale bar shows 100 µm. H‐score of TNF‐α (F) IL‐6 (G) and CD68 (H) expression. Mann–Whitney test; **p < 0.01, ***p < 0.001, ns, not significant. Correlation analysis of m6A levels in tumour small Te‐EVs and the H‐scores of TNF‐α (I) or IL‐6 (J) in corresponding colorectal cancer clinical tissues. Spearman's correlation coefficient (r) was calculated. Correlation analysis of m6A levels in tumour large Te‐EVs and the H‐scores of TNF‐α (K) or IL‐6 (L) in corresponding colorectal cancer clinical tissues. Spearman's correlation coefficient (r) was calculated.
FIGURE 4
FIGURE 4
m6A levels in EVs regulate inflammatory responses via TLR8 in macrophages. Differentiated THP‐1 cells (dTHP‐1) were pretreated with or without CU‐CPT‐9a and CU‐CPT‐4a. (A) Whole‐cell lysates obtained from dTHP‐1 cells were subjected to Western blot analysis using an anti‐phospho p65 antibody, anti‐p65 antibody and anti‐β‐actin antibody. Representative images from three independent experiments are shown. Conditioned medium from dTHP‐1 cells treated with CCD‐841‐CoN or HT29 small EVs was used for ELISA. TNF‐α (B, left and C, left), and IL‐6 (B, right and C, right). Values are presented as the mean ± SEM for each group. One‐way ANOVA post hoc Tukey's test; *p < 0.05, **p < 0.01, ***p < 0.001. ns, not significant. dTHP‐1 cells were pre‐transfected with or without TLR8 siRNA. (D) Whole‐cell lysates obtained from dTHP‐1 cells treated with CCD‐841‐CoN small EVs or HT29 small EVs were subjected to Western blot analysis using an anti‐phospho p65 antibody, anti‐p65 antibody and anti‐β‐actin antibody. Representative images from three independent experiments are shown. Conditioned medium was used for the ELISA. TNF‐α (E, left) and IL‐6 (E, right). Values are presented as the mean ± SEM for each group. One‐way ANOVA post hoc Tukey's test; **p < 0.01, ***p < 0.001, ****p < 0.0001. dTHP‐1 cells were pre‐transfected with or without TLR3 siRNA. (F) Whole‐cell lysates obtained from dTHP‐1 cells treated with CCD‐841‐CoN small EVs or HT29 small EVs were subjected to Western blot analysis using an anti‐phospho p65 antibody, anti‐p65 antibody and anti‐β‐actin antibody. Representative images from three independent experiments are shown. Conditioned medium was used for ELISA. TNF‐α (G, left) and IL‐6 (G, right). Values are presented as the mean ± SEM for each group. One‐way ANOVA post hoc Tukey's test; ***p < 0.001, ****p < 0.0001; ns, not significant. (H) HT29 cells were cultured in a conditioned medium from dTHP‐1 cells transfected with or without TLR8 siRNA and CCD‐841‐CoN small EVs or HT29 small EVs. Values are presented as the mean ± SEM for each group. One‐way ANOVA post hoc Tukey's test; *p < 0.05, **p < 0.01. HT29‐derived EVs‐RNA were pretreated with or without rALKBH5 and introduced into dTHP‐1 cells transfected with or without TLR8 siRNA. TNF‐α (I) and IL‐6 (J) concentrations were measured via ELISA using conditioned medium from dTHP‐1 cells. Values are presented as the mean ± SEM for each group. One‐way ANOVA post hoc Tukey's test; *p < 0.05, ***p < 0.001, ****p < 0.0001, ns, not significant. See also Figure S7.
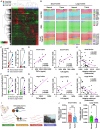
FIGURE 5
FIGURE 5
5′‐half‐GlyGCC is enriched in both small and large tumour Te‐EVs with reduced m6A levels. (A) Heatmap of small RNA‐seq data obtained from normal (n = 6) and tumour (n = 6) small and large Te‐EVs. (B) Percentage dot plot of each RNA species, tRNA fragment species, and tRF‐encoded amino acid species in Te‐EVs from small RNA‐seq data. Read counts of 5′‐half‐GlyGCC in normal (n = 6) and tumour (n = 6) small Te‐EVs (C, left). Quantitative PCR results for 5′‐half‐GlyGCC (C, right, n = 11). Correlation analysis of 5′‐half‐GlyGCC levels in small Te‐EVs and the amount of TNF‐α (D, left) or IL‐6 (D, right) released from small Te‐EV‐treated monocyte‐derived macrophage (MDMs). Spearman's correlation coefficient (r) was calculated. (E) Correlation analysis of m6A and 5′‐half‐GlyGCC levels in small Te‐EVs. Spearman's correlation coefficient (r) was calculated. Read counts of 5′‐half‐GlyGCC in normal (n = 6) and tumour large (n = 6) Te‐EVs (F, left). Quantitative PCR results for 5′‐half‐GlyGCC (F, right, n = 11). Correlation analysis of 5′‐half‐GlyGCC levels in large Te‐EVs and the amount of TNF‐α (G, left) or IL‐6 (G, right) released from large Te‐EV‐treated MDMs. Spearman's correlation coefficient (r) was calculated. (H) Correlation analysis of m6A and 5′‐half‐GlyGCC levels in large Te‐EVs. Spearman's correlation coefficient (r) was calculated. (I) Experimental scheme for Te‐EVs: RNA isolation, pull‐down of 5′‐half‐GlyGCC, and subsequent RNA modification analysis. m6A levels of 5′‐half‐GlyGCC obtained from normal and tumour‐derived EV‐RNA. Small (J) and large Te‐EVs (K). Values are presented as the mean ± SEM for each group. Wilcoxon signed‐rank test; **p < 0.01 (n = 11). See also Figures S8 and S9.
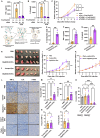
FIGURE 6
FIGURE 6
5′‐half‐GlyGCC in tumour EVs promotes tumour growth in vivo. Differentiated THP‐1 cells (dTHP‐1) were pre‐transfected with or without TLR8 siRNA and 5′‐half‐GlyGCC. Conditioned medium from dTHP‐1 cells was used for the ELISA. TNF‐α (A) and IL‐6 (B). Values are presented as the mean ± SEM for each group. One‐way ANOVA post hoc Tukey's test; **p < 0.01, ***p < 0.001. (C) HT29 cells were cultured in a conditioned medium from dTHP‐1 cells transfected with or without TLR8 siRNA and 5′‐half‐GlyGCC. Values are presented as the mean ± SEM for each group. One‐way ANOVA post hoc Tukey's test; **p < 0.01, ***p < 0.001. (D) Experimental scheme for the introduction of 5′‐half‐GlyGCC into colon26 small EVs and subsequent analysis. (E) Results of quantitative PCR of 5′‐half‐GlyGCC‐loaded colon26 small EVs (GlyGCC(+) EVs). Values are presented as the mean ± SEM for each group. Unpaired t‐test; **p < 0.01. ELISA was conducted using conditioned medium from RAW264.7 cells treated with GlyGCC(+) EVs. TNF‐α (F) and IL‐6 (G) concentration. Values are presented as the mean ± SEM for each group. Unpaired t‐test; *p < 0.05, **p < 0.01. Colon26 cells were injected into BALB/c mice. PBS, Control EVs or GlyGCC(+) EVs were injected i.p. Representative xenograft tumour images (H) are shown. White scale bar, 1 cm. Tumour size was measured and calculated daily (I). Values are presented as the mean ± SEM for each group. One‐way ANOVA post hoc Tukey's test; *p < 0.05, ***p < 0.001. Colon26 cells were injected into BALB/c mice. PBS, Control EVs or GlyGCC(+) EVs and clodronate liposomes were injected i.p. Representative xenograft tumour images (J) are shown. White scale bar, 1 cm. Tumour size was measured and calculated every day (K). Values are presented as the mean ± SEM for each group. Unpaired t‐test; ns, not significant. (L) Immunohistochemical analysis of TNF‐α, IL‐6 and F4/80 expression in tumour tissues of mice inoculated with small EVs obtained from GlyGCC(+) EVs and clodronate liposomes. Scale bar: 100 µm. Representative images of six (PBS, Control EVs, GlyGCC(+) EVs, and Control EVs with clodronate liposomes) or five (GlyGCC(+) EVs with clodronate liposomes) independent experiments are shown. H‐scores of TNF‐α (M, left) and IL‐6 (M, right) expression in GlyGCC(+) EV injection experiments. Values are presented as the mean ± SEM for each group. One‐way ANOVA post hoc Tukey's test; *p < 0.05, **p < 0.01, ns, not significant. H‐score of TNF‐α (N, left) and IL‐6 (N, right) expression in GlyGCC(+) EVs combined with clodronate liposome injection. Values are presented as the mean ± SEM for each group. Unpaired t‐test; ns, not significant. (O) H‐score of F4/80 expression in GlyGCC(+) EVs, with or without clodronate liposome injection. Values are presented as the mean ± SEM for each group. Unpaired t‐test; ns, not significant. See also Figures S10–S12.

References

    1. Abedizadeh, R. , Majidi F., Khorasani H. R., Abedi H., and Sabour D.. 2023. “Colorectal Cancer: A Comprehensive Review of Carcinogenesis, Diagnosis, and Novel Strategies for Classified Treatments.” Cancer and Metastasis Reviews 43: 729–753. 10.1007/s10555-023-10158-3. - DOI - PubMed
    1. Barbieri, I. , and Kouzarides T.. 2020. “Role of RNA Modifications in Cancer.” Nature Reviews Cancer 20: 303–322. 10.1038/s41568-020-0253-2. - DOI - PubMed
    1. Becker, A. , Thakur B. K., Weiss J. M., Kim H. S., Peinado H., and Lyden D.. 2016. “Extracellular Vesicles in Cancer: Cell‐to‐Cell Mediators of Metastasis.” Cancer Cell 30: 836–848. 10.1016/j.ccell.2016.10.009. - DOI - PMC - PubMed
    1. Chen, F. , Song C., Meng F., et al. 2023. “5′‐tRF‐GlyGCC Promotes Breast Cancer Metastasis by Increasing Fat Mass and Obesity‐Associated Protein Demethylase Activity.” International Journal of Biological Macromolecules 226: 397–409. 10.1016/j.ijbiomac.2022.11.295. - DOI - PubMed
    1. Chen, Z. , Qi M., Shen B., et al. 2019. “Transfer RNA Demethylase ALKBH3 Promotes Cancer Progression via Induction of tRNA‐Derived Small RNAs.” Nucleic Acids Research 47: 2533–2545. 10.1093/nar/gky1250. - DOI - PMC - PubMed

LinkOut - more resources