. 2025 May 15;152(10):dev204258.
doi: 10.1242/dev.204258. Epub 2025 May 16.

A function of Spalt proteins in heterochromatin organization and maintenance of genomic DNA integrity

Affiliations

A function of Spalt proteins in heterochromatin organization and maintenance of genomic DNA integrity

Cristina M Ostalé et al. Development. .

Abstract

The conserved Spalt proteins regulate gene expression and cell fate choices during multicellular development, generally acting as transcriptional repressors in different gene regulatory networks. In addition to their roles as DNA sequence-specific transcription factors, Spalt proteins show a consistent localization to heterochromatic regions. Vertebrate Spalt-like proteins can act through the nucleosome remodeling and deacetylase complex to promote closing of open chromatin domains, but their activities also rely on interactions with DNA methyltransferases or with the lysine-specific histone demethylase LSD1, suggesting that they participate in multiple regulatory mechanisms. Here, we describe several consequences of loss of Spalt function in Drosophila cells, including changes in chromatin accessibility, generation of DNA damage, alterations in the localization of chromosomes within the nucleus in the salivary glands and misexpression of transposable elements. We suggest that these effects are related to roles of Spalt proteins in the regulation of heterochromatin formation and chromatin organization. We propose that Drosophila Spalt proteins have two complementary functions, acting as sequence-specific transcriptional repressors on specific target genes and regulating more global gene silencing through the generation or maintenance of heterochromatic domains.

Keywords: Drosophila; Gene expression; Heterochromatin; Nuclear lamina; Nucleolus; Spalt proteins.


Conflict of interest statement

Competing interests The authors declare no competing or financial interests.

Figures
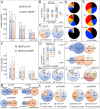
Fig. 1.
Fig. 1.
Changes in chromatin accessibility in salm/salr knockdown imaginal discs. (A) Number of genomic regions (peaks) showing enrichment (ATAC-UP; blue) or depletion (ATAC-DOWN; red) comparing ATAC-seq data from salm/salr RNAi knockdown (salEPv-Gal4/UAS-salm-RNAi; UAS-salr-RNAi/+) and control (salEPv-Gal4 UAS-GFP/+) wing discs. The DNA regions were identified at 0.05, 0.01 and 0.001 false discovery rates (FDR). (B) Percentage of peaks located 0-1, 1-5 and more than 5 Kb from the nearest transcription start site (TSS). ATAC-UP and ATAC-DOWN peaks are shown in blue and red, respectively. (C) Percentage of genes expressed (Expression; blue) or not expressed (No expression; red) in the wing disc in the ATAC-UP (left) and ATAC-DOWN (right) datasets. The percentage and absolute number of genes are indicated by numbers. (D,E) Percentage of sequences belonging to the ATAC-UP (D) and ATAC-DOWN (E) classes included in black, blue, green, yellow and red chromatin domain states (Filion et al., 2011). The black, blue and green states represent different types of heterochromatin, and the red and yellow states correspond to euchromatin. The gray sector represents sequences not associated to any of these stages. The data refer to the total number of genes analyzed (T; up), to genes expressed in wild-type imaginal discs (Exp; middle) and to genes not expressed in the wing disc (No Exp; bottom). (F) Number of genomic regions (peaks) showing enrichment (H3K27ac-UP; blue) or depletion (H3K27ac-DOWN; red) comparing the H3K27ac ChIP-seq data of salEPv-Gal4/UAS-salm-RNAi; UAS-salr-RNAi/+ and salEPv-Gal4 UAS-GFP/+ wing discs. The DNA regions were identified at 0.05, 0.01 and 0.001 FDR. (G) Percentage of H3K27ac peaks located 0-1, 1-5 and more than 5 Kb from the nearest TSS. The H3K27ac-UP and H3K27ac-DOWN peaks are shown in blue and red, respectively. (H) Percentage of genes expressed in the wild-type wing disc (Expression; blue) or not expressed in the wild-type wing disc (No expression; red) in the H3K27ac-UP (left) and H3K27ac-DOWN (right) datasets. (I) Comparison between genomic regions showing ATAC-seq enrichment or depletion (ATAC-UP: FDR 0.05, blue; ATAC-DOWN: FDR 0.05, red) with those enriched or depleted in the H3K27ac ChIP-seq dataset (H3K27ac-UP and H3K27ac-DOWN, respectively). (J) Frequencies of sequences included in both the ATAC and H3K27ac datasets: ATAC-UP and H3K27ac-UP (UP-UP) and ATAC-UP and H3K27ac-DOWN (UP-DOWN) are shown in the left graphic, ATAC-DOWN and H3K27ac-UP (DOWN-UP) and ATAC-DOWN and H3K27ac-DOWN (DOWN-DOWN) are shown in the right graphic. (K) Number of genes for which expression is augmented (Sal-UP) or reduced (Sal-DOWN) in salm/salr mutant discs included in the ATAC-UP (blue), ATAC-DOWN (red), H3K27ac-UP (blue) and H3K27ac-DOWN (red) datasets. (L) Frequency of genes included in both the salm/salr RNA-seq expression datasets (sal-UP and sal-DOWN) and the ATAC-UP (blue), ATAC-DOWN (red), H3K27ac-UP (blue) and H3K27ac-DOWN (red) datasets. The number of genes included in these calculations are indicated in each circle.
Fig. 2.
Fig. 2.
Distribution of sequences identified in the ATAC and H3K27ac in relation to pericentromeric heterochromatin. (A,B) Percentage of base pair coverage (% bp coverage; A) and overlapping peaks (% peaks; B) associated to pericentromeric heterochromatin in the ATAC (blue columns), H3K27ac (red columns), H3K9me3, HP1 and Salm ChIP experiments (gray columns). (C,D) Overlap between sequences identified in H3K9me3 ChIP-seq (C) and HP1 ChIP-seq (D) with all genomic sequences (yellow columns; Genome) or with sequences present in the ATAC (blue columns) or H3K27ac (red columns), and in both ATAC and H3K27ac datasets (UP-UP and DOWN-DOWN columns, gray). Sequences identified in H3K9me3 ChIP-seq present in the HP1 ChIP-seq experiments, as well as sequences identified in the HP1 ChIP-seq and present in the H3K9me3 ChIP-seq experiments are shown in the brown columns.
Fig. 3.
Fig. 3.
Changes in gene expression in heterochromatic regions in salm/salr heterozygous flies and embryos. (A,B) Eyes from 2-day old w; CyO/P{w[+mW.hs] (A) and w; Df(2L)32FP5/P{w[+mW.hs] (B) females. The insertion P{w[+mW.hs] is located in the telomere associated sequence (TAS) of the 2R chromosomic arm. (C,D) Eyes from 2-day old w; CyO/+; P{w[+mW.hs]/+ (C) and w; Df(2L)32FP5/+; P{w[+mW.hs]/+ females (D). The insertion P{w[+mW.hs] is located in the TAS of the 3R chromosomic arm. (E) Eye pigment quantification (measured in absorbance at 480 nm) of w; CyO/+; P{w[+mW.hs]/+ and w; Df(2L)32FP5/+; P{w[+mW.hs]/+ (two left columns) and w; CyO/P{w[+mW.hs]/CyO and w; Df(2L)32FP5/P{w[+mW.hs] (two right columns). (F) Expression (qPCR) of the retrotransposons HetA, TART-A and F-element in control embryos (wt; black columns) and in embryos obtained from Df(2L)32FP5 heterozygous flies (Df5; gray columns). (G-H′) Distribution of HP1 (red) and DAPI (blue) in salivary gland nuclei from larvae of AB1-Gal4 UAS-GFP/+ (G,G′) and AB1-Gal UAS-GFP/UAS-salm-RNAi; UAS-salr-RNAi/+ (H,H′). The corresponding red channels are shown in G′ and H′. (I) Confocal images of mitotic chromosomes (DAPI, blue) of a syncytial blastoderm from heterozygous Df(2L)32FP5 parents. (J,K) Higher magnification of independent fields showing defective mitotic figures such as asynchronic mitosis (J) and anaphase bridges (white arrowheads, K). (L) Frequency of anaphase bridges in blastoderms from heterozygous Df(2L)32FP5 parents. (M-N″) Distribution of H4K12ac (green in M,N; white in M′,N′), Phospho-Histone3 (PH3, red in M,N; white in M″,N″) and DAPI (blue in M,N) in wild-type cycle 12 blastoderms (M-M″) and cycle 12 blastoderms from heterozygous Df(2L)32FP5 flies (N-N″). The confocal settings were the same in all pictures shown in panels M-N″. **P<0.01, ****P<0.0001 (paired Student's t-test). Data are mean±s.d. Scale bars: 10 μm (G-H′, J,K); 50 μm (I,M-N″).
Fig. 4.
Fig. 4.
DNA damage in salm/salr mutant wing imaginal discs. (A) Expression of GFP (green) in the wing blade of salEPv-Gal4 UAS-GFP/+ late third instar wing disc. DAPI staining is shown in blue. (B-D) Representative examples of wing imaginal disc nuclei obtained from salEPv-Gal4 UAS-GFP/+ (B), salEPv-Gal UAS-GFP/UAS-salm-RNAi; UAS-salr-RNAi/+ (C) and salEPv-Gal4 UAS-GFP/+ dissociated discs treated for 10 min with H2O2 50 µM (D). (E,F) Percentage of tail DNA (E) and value of tail moment (F) in the single cell electrophoresis assay from salEPv-Gal4 UAS-GFP/+ (blue dots), salEPv-Gal UAS-GFP/UAS-salm-RNAi; UAS-salr-RNAi/+ (red dots) and salEPv-Gal4 UAS-GFP/+ nuclei exposed to H2O2 (gray dots). Horizontal lines indicate median. (G,H) Expression of phosphorylated H2Av (red) in control (salEPv-Gal UAS-GFP/+; G) and salEPv-Gal UAS-GFP/UAS-salm-RNAi; UAS-salr-RNAi/+ discs (H). (I-J′) Expression of p53 (red in I,J) in salEPv-Gal4 UAS-GFP/+ (I,I′) and salEPv-Gal UAS-GFP/UAS-salm-RNAi; UAS-salr-RNAi/+ discs (J,J′). GFP is in green (I,J) and DAPI staining is in blue (I,J). Individual red channels (p53) are shown in I′,J′. The confocal settings were the same in all pictures shown in panels I-J′.
Fig. 5.
Fig. 5.
Salivary gland phenotypes of salm/salr knockdown larvae. (A-A″) Expression of Salm (red in A,A′) and DAPI staining (blue in A and A″) in wild-type salivary glands from late third instar larvae. (B-D) salEPv-Gal4 UAS-GFP/+ (B), salEPv-Gal4 UAS-GFP/UAS-salm-RNAi; UAS-salr-RNAi/+ (C) and UAS-salm-RNAi/+; AB1-Gal4/UAS-salr-RNAi (D) salivary gland cells (40×) showing the expression of GFP (green) and DAPI staining (blue). (E-H) Lower magnification pictures (25×) of salEPv-Gal4 UAS-GFP/+ (E), salEPv-Gal4 UAS-GFP/UAS-salm-RNAi; UAS-salr-RNAi/+ (F), UAS-salm-RNAi/+; AB1-Gal4/UAS-salr-RNAi female (G) and UAS-salm-RNAi/+; AB1-Gal4/UAS-salr-RNAi male (H). DAPI staining is in white. (I-K) Salivary gland area (I), number of cells (J) and nuclear area (K) from salEPv-Gal4 UAS-GFP/+ (sal>GFP), salEPv-Gal4 UAS-GFP/UAS-salm-RNAi; UAS-salr-RNAi/+ (sal>sal-i) and UAS-salm-RNAi/+; AB1-Gal4/UAS-salr-RNAi females (AB1>sal-i). *P<0.05, **P<0.01, ***P<0.001 (paired Student's t-test). Box plots show median values (middle bars) and first to third interquartile ranges (boxes). (L,N) TEM images of the nucleus (1200×) in salEPv-Gal4 UAS-GFP/+ (L) and salEPv-Gal4 UAS-GFP/UAS-salm-RNAi; UAS-salr-RNAi/+ (N) salivary glands. (M,O) Expression of the nucleolar marker fibrillarin (Fib; red) and DAPI staining (blue) in salEPv-Gal4 UAS-GFP/+ (M) and salEPv-Gal4 UAS-GFP/UAS-salm-RNAi; UAS-salr-RNAi/+ (O) salivary glands. The insets in M and O are magnifications (3×) showing single nuclei. Scale bars: 10 μm (A-H,M,O).
Fig. 6.
Fig. 6.
Gene expression in salm/salr knockdown and irradiated wing imaginal discs. (A) Venn diagrams showing the overlap in the genes showing expression changes in salm/salr knockdown discs (Organista et al., 2015) and in irradiated wing discs (van Bergeijk et al., 2012). UP and DOWN indicates genes for which expression is increased (UP) or decreased (DOWN). The percentage of overlapping genes is shown in the smaller bottom diagrams (Up/Down, Up/Up; left, and Down/Down and Down/Up; right). (B) Log(2)FC values after irradiation of wild-type wing imaginal discs (van Bergeijk et al., 2012) for genes showing ectopic expression in the central domain of salm/salr mutant discs. All genes within blue boxes are related to DNA damage responses. (C) Late third instar wing discs showing mRNA expression in a salEPv-Gal4/UAS-salm-RNAi; UAS-salr-RNAi genetic background (Organista et al., 2015). Only the expression of CG10916 in wild-type wing discs is shown in the first panel. All other genes are either not expressed or expressed in all cells at low levels in wild-type wing discs. (D-G) Expression of the regulatory region of Gadd45 (D,E) and ver (F,G) in third instar wing imaginal discs of Gadd45 pHP-Dest-eGFP and ver pHP-Dest-eGFP genotypes. The larvae were grown in normal conditions (D,F) or irradiated with 3000 R 2 h before dissection (E,G). (H,I) Expression of p53 in wild-type wing discs (H) and in wild-type wing discs irradiated with 3000 R 2 h before dissection (I). The confocal settings were the same in the pictures shown in panels D-G and H,I.
Fig. 7.
Fig. 7.
Proposed model for Salm/Salr function. (A,B) Cartoon representing wild-type (A) and Salm/Salr mutant (B) nuclei. The nuclear envelope is drawn as a double line showing the nuclear pore complexes (NPC). Lamins are drawn as crisscross blue lines surrounding the nuclear envelope and the nucleolus (gray round shape). Chromosomal DNA is represented by red, green and yellow lines. The Salm/Salr proteins are represented as black and red shapes, indication Salm/Salr binding to euchromatic regions and acting as a canonical sequence-specific transcription factor (red) or as a heterochromatic binding protein (black). The main alterations observed in salm/salr mutant polyploid cells are shown in B, including wiggly nuclear envelope, enlarged nucleolus and reorganization of nuclear DNA around the periphery of the nucleus. (C) Working hypothesis to account for the variety of genomic and cellular changes observed in salm/salr knockdowns or mutant conditions. We propose that loss of Salm/Salr function affects the formation or maintenance of heterochromatic regions, leading to abnormal expression of transposable elements and other heterochromatic sequences, generating transcription-replication conflicts (T//R) and/or R-loops leading to single-strand DNA breaks (SSB) and the activation of a p53 DNA damage response. We also indicate the possibility of direct repression of p53 by Salm/Salr proteins.

References

    1. Álvarez, C., Quiroz, A., Benítez-Riquelme, D., Pincheira, R., Riffo, E. and Castro, A. F. (2021). SALL proteins; common and antagonistic roles in cancer. Cancers 13, 6292. 10.3390/cancers13246292 - DOI - PMC - PubMed
    1. Ballmer, D., Tardat, M., Ortiz, R., Graff-Meyer, A., Ozonov, E. A., Genoud, C., Peters, A. H. F. M. and Fanourgakis, G. (2023). HP1 proteins regulate nucleolar structure and function by secluding pericentromeric constitutive heterochromatin. Nucleic Acids Res. 51, 117-143. 10.1093/nar/gkac1159 - DOI - PMC - PubMed
    1. Baonza, A., Tur-Gracia, S., Pérez-Aguilera, M. and Estella, C. (2022). Regulation and coordination of the different DNA damage responses in Drosophila. Front. Cell Dev. Biol. 10, 993257. 10.3389/fcell.2022.993257 - DOI - PMC - PubMed
    1. Barrio, R., De Celis, J. F., Bolshakov, S. and Kafatos, F. C. (1999). Identification of regulatory regions driving the expression of the Drosophila spalt complex at different developmental stages. Dev. Biol. 215, 33-47. 10.1006/dbio.1999.9434 - DOI - PubMed
    1. Basta, J. M., Robbins, L., Denner, D. R., Kolar, G. R. and Rauchman, M. (2017). A sall1-NuRD interaction regulates multipotent nephron progenitors and is required for loop of henle formation. Development 144, 3080-3094. 10.1242/dev.148692 - DOI - PMC - PubMed

MeSH terms

LinkOut - more resources